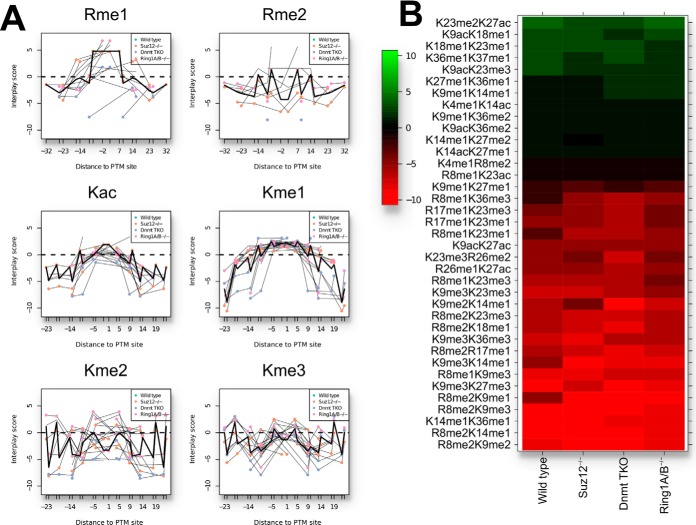
Fig. 5.
Overview of histone H3 tail PTM interplay. General patterns of PTM crosstalk on H3 are revealed by investigation of the trend lines with respect to the mutual distance on the protein sequence, as well as by determining the conservation of crosstalk across the different cell lines. A, Averaged crosstalk within PTM types arginine methylation and lysine methylation and acetylation. For each PTM, interplay scores with other PTMs versus the distance from their residues are shown (thin lines). The thick line denotes mean values taken over all interplay scores at a distance. Thus the panels show general trends within PTM types, such as positive crosstalk between nearby mono-methylations and acetylations. B, Conserved interplay values between cell lines according to a standard t test (p value corrected for multiple testing according to Benjamini-Hochberg, p < 0.1). Only PTMs with wild type abundance above 2% were considered.

