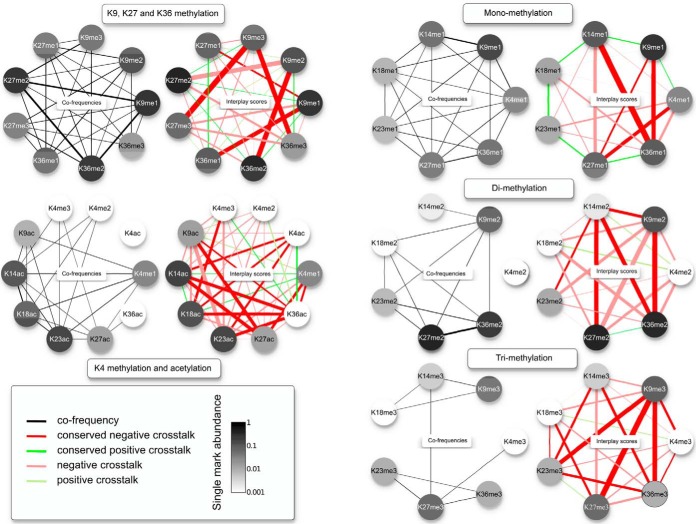
Fig. 6.
Fine-structure of conserved crosstalk between selected PTMs. Graph representations of PTM subsets show averaged frequencies of single and double marks and quantitative crosstalk rules. PTM abundance is represented on grayscale. Thickness of black lines denotes cofrequencies. Red and green lines represent conserved interplay values (t test, p < 0.1) and light red and green lines correspond to interplay values not found to be conserved. For all values, the average over the four cell lines was taken.

