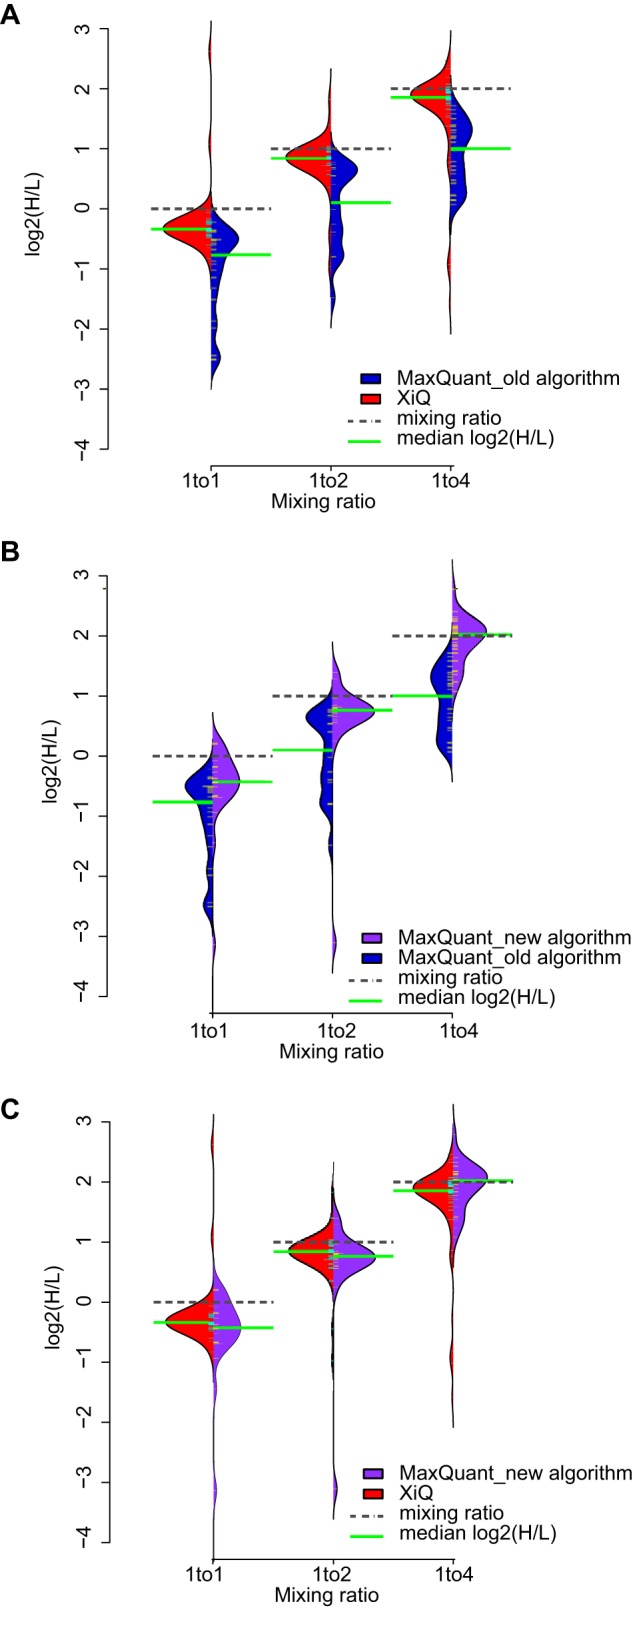
Fig. 3.

MaxQuant is capable of quantifying cross-linked peptides. Quantitation results of data set 1 using quantification from feature list in MaxQuant are compared with the previously published results using standard quantification in MaxQuant and XiQ. A, Bean plots showing the distribution of H/L ratios of cross-links for each mixing ratio quantified using XiQ (red) and standard quantification in MaxQuant (blue). B, Bean plots showing the distribution of H/L ratios of cross-links for each mixing ratio quantified using quantification from feature list in MaxQuant (purple) and standard quantification in MaxQuant (blue). C, Bean plots showing the distribution of H/L ratios of cross-links for each mixing ratio quantified using quantification from feature list in MaxQuant (purple) and XiQ (red).
