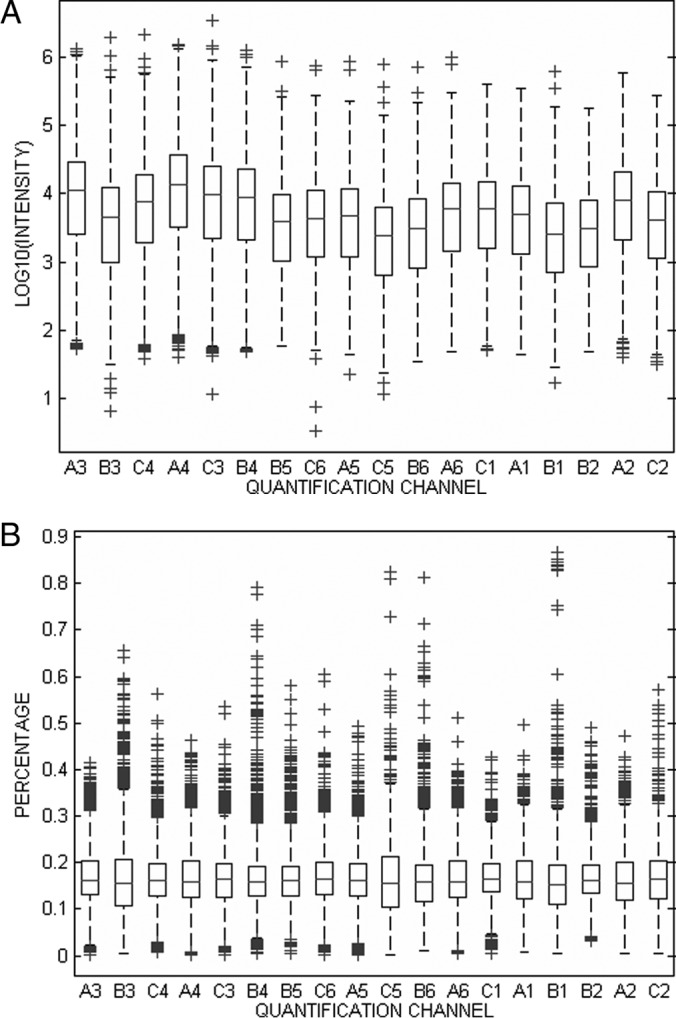
Fig. 2.

Tukey boxplot of the transformed reporter ion intensities in the 18 quantification channels. The six first boxplots come from experiment TMT2, the next six from TMT3, and the last six from TMT1. A, logarithmically transformed intensities before normalization. B, reporter ion intensities after CONSTANd normalization.
