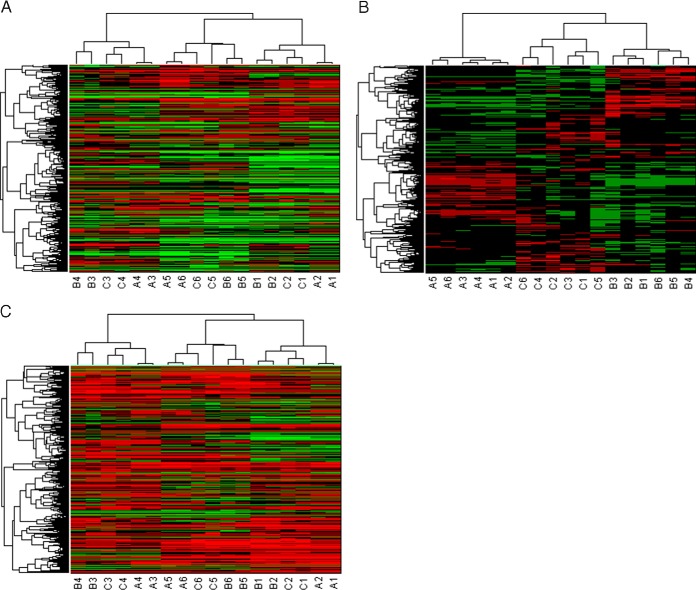
Fig. 3.
Hierarchical clustering of the reporter ion intensities. The color code in the heatmap reflect the intensities where green represent the lower intensities and red the higher intensities. The columns of the heatmap are the 18 quantification channels and the rows indicate the 971 non-redundant and modified peptides. The rows and columns are permuted to correspond the clusters form the hierarchical clustering. The dendrogram visually represent the clusters that are found for the peptides (left) and the quantification channels (top). The clustering starts from a single root node and branches in subtrees up toward the leafs (18 leafs for the quantification channels and 971 leafs for the peptides). The distance in the dendrogram illustrates the Spearman correlation. Note that the in vitro (A) condition are stronger correlated than the in vivo conditions (B, C). A, Quantile normalization, the color code in on the log10-scale. B, CONSTANd normalization: the color code is a percentage. C, “Median sweep” normalization, the color code in on the log10-scale. Each quantification channel as a median value of zero.

