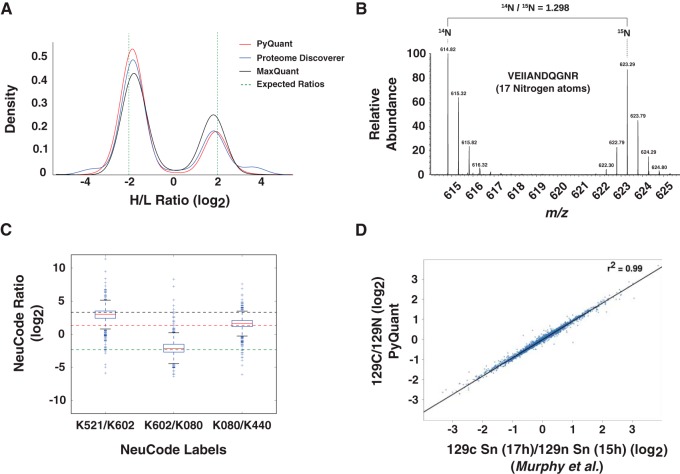
Fig. 2.
PyQuant correctly quantifies various quantitative mass spectrometry data methods. A, Two known mixtures of SILAC isotopes in E. coli is quantified with three different platforms: PyQuant (red line), MaxQuant (black line), and Proteome Discover (blue line). The expected log2 ratios are −2, and 2, which are indicated by a dashed green line. All three programs are centered on approximately the same ratios, and have similar peak widths. B, PyQuant is able to correctly quantify 15N labeled data. The raw MS1 spectrum of a peptide from a sample comprised of both 15N and 14N labeled peptides is plotted. The ratio of the two species as calculated by PyQuant is shown above, which agrees with the manual interpretation of the relative abundance levels. C, A multiplexed experiment that is labeled with NeuCode is shown. The box-plots indicate the distribution of peptides quantified by PyQuant, and the dashed lines indicate known mixture ratios. As shown, the median value, represented by a red line within the box-plot, for each ratio measured is approximately equal to the known mixing ratio. Thus, PyQuant is capable of reproducing the known mixtures of isotopes in the experiment. D, PyQuant is used to quantify a TMT 10-plex experiment using MS3 fragmentation for quantification. On the x axis are values obtained by Murphy et al. in their study, and on the y axis are the same values obtained by PyQuant. As shown, the values are nearly indistinguishable, providing evidence that PyQuant is capable of MS3-based quantification.

