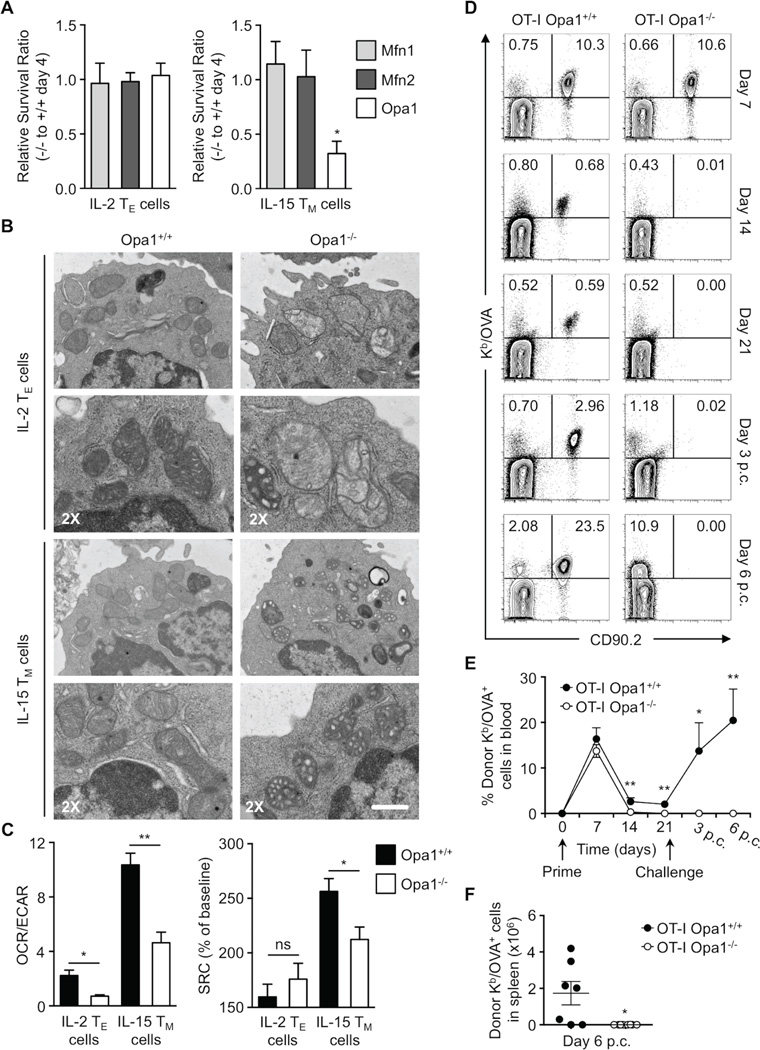
Figure 2. Memory T cell development and survival, unlike effectors, requires mitochondrial fusion.
(A) Relative in vitro survival ratios of Mfn1, Mfn2, or Opa1 deficient (CD4 Cre+, −/−) to wild-type (CD4 Cre-, +/+) OT-I IL-2 TE and IL-15 TM cells (*p=0.0465). Data normalized from 2–3 independent experiments shown as mean ± SEM. (B) Mitochondrial morphology of OT-I Opa1 wild-type and Opa1−/− IL-2 TE and IL-15 TM cells analyzed by EM (scale bar = 0.5 µm, represents one experiment) and (C) Seahorse EFA. (Left) bar graph represents ratios of O2 consumption rates (OCR, indicator of OXPHOS) to extracellular acidification rates (ECAR, indicator of aerobic glycolysis) at baseline and (right) spare respiratory capacity (SRC) (% max OCR after FCCP injection of baseline OCR) of indicated cells (*p<0.03, **p=0.0079). Data from 3 experiments shown as mean ± SEM. (D–F) 104 OT-I Opa1+/+ or Opa1−/− T cells were transferred i.v. into C57BL/6 CD90.1 mice infected i.v. with 107 CFU LmOVA. Blood analyzed by flow cytometry at indicated times post infection. After 21 days, mice were challenged i.v. with 5×10⁷ CFU LmOVA and blood analyzed post challenge (p.c.). (D) % Donor Kb/OVA+ CD90.2+ cells shown in representative flow plots and (E) line graph with mean ± SEM (*p=0.0238, **p<0.005). (F) Number of donor Kb/OVA+ cells from spleens of infected mice shown with mean ± SEM (*p=0.0126). (D–F) Representative of 2 experiments (n=9–11/ group). See also Figure S2.

