FIGURE 2.
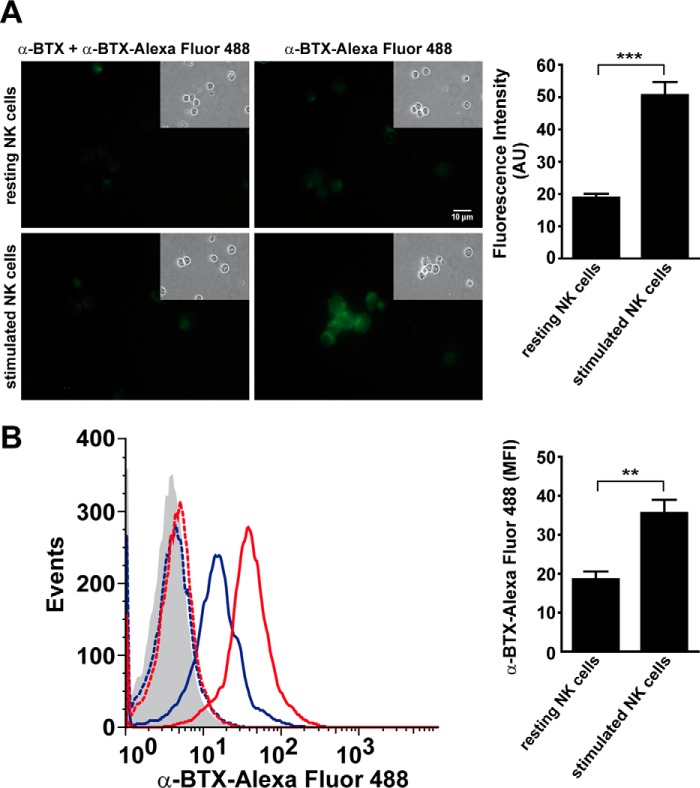
Human NK cells express cell surface α7 nAChR. Human NK cells were incubated with and without IL-12/IL-18/IL-15 for 48 h and stained with Alexa Fluor 488-labeled α-BTX. Then the cells were analyzed by fluorescence microscopy (A) and FC (B). A, representative fluorescence microscopy images of resting NK cells (upper panel) or NK cells stimulated with cytokines (lower panel) and incubated with labeled α-BTX. Left images correspond to human NK cells preincubated with unlabeled α-BTX before the addition of Alexa Fluor 488-labeled α-BTX as a specificity control. Insets, phase-contrast micrographs of the same cells. B, FC analysis of resting or cytokine-stimulated NK cells stained with labeled α-BTX. Gray histograms, unstained cells; blue dashed line, resting NK cells preincubated with unlabeled α-BTX; red dashed line, stimulated NK cells preincubated with unlabeled α-BTX; blue line, resting NK cells; red line, stimulated NK cells. Data shown in A and B are representative of three independent experiments performed with NK cells from different donors (n = 5). **, p < 0.01; ***, p < 0.001; paired t test. Bar graphs show results as mean ± S.E of the average fluorescence intensity of cell surface-labeled α-BTX.

