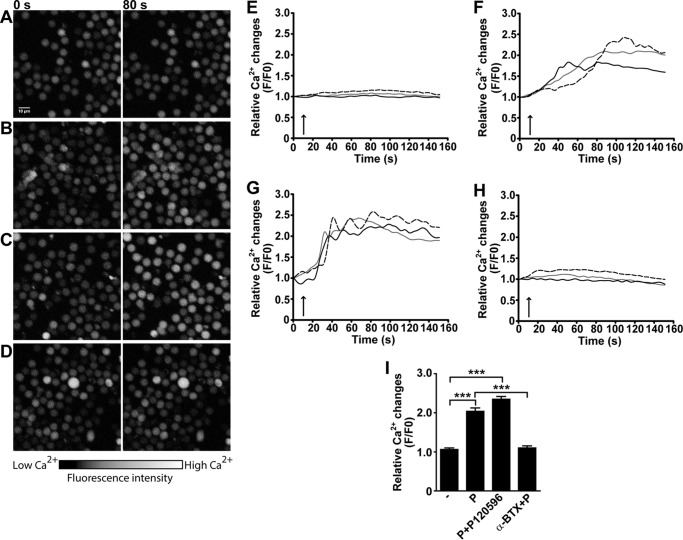
FIGURE 3.
Activation of α7 nAChR in human NK cells triggers Ca2+ mobilization. Human NK cells were stimulated with IL-12/IL-18/IL-15 for 48 h, loaded with Fluo-3/AM, and analyzed by laser scanning microscopy as described under “Experimental Procedures.” The images were obtained immediately before (0 s) and after 80 s (80 s) of exposure to the drugs, which corresponds to the time at which the maximum Ca2+ increase was typically observed. The color scale represents the relative fluorescence intensity of Fluo-3/AM-loaded cells, with black representing the lowest and white the highest [Ca2+]i. The cells were incubated in the absence (−) (A and E) or presence of: 30 μm PNU-282987 (P) (B and F), 30 μm PNU-282987 and 3 μm PNU-120596 (P + P120596) (C and G), 30 μm PNU-282987 after 15 min preincubation with 1 μm α-BTX (α-BTX + P) (D and H). Relative fluorescence values were calculated as F/F0 to represent the relative [Ca2+]i levels. Each curve represents the variations of intracellular Ca2+ in one cell, and the responses of three representative cells are shown for each condition. The arrow indicates the time of drug application. I, bars represent mean ± S.E. of the relative fluorescence intensity of each cell (measured at the maximum value) from each condition. The data are representative of three independent experiments performed with NK cells from different donors (n = 5). At least 100 cells/condition were analyzed. ***, p < 0.001; one-way ANOVA test with Bonferroni post hoc test.

