FIGURE 6.
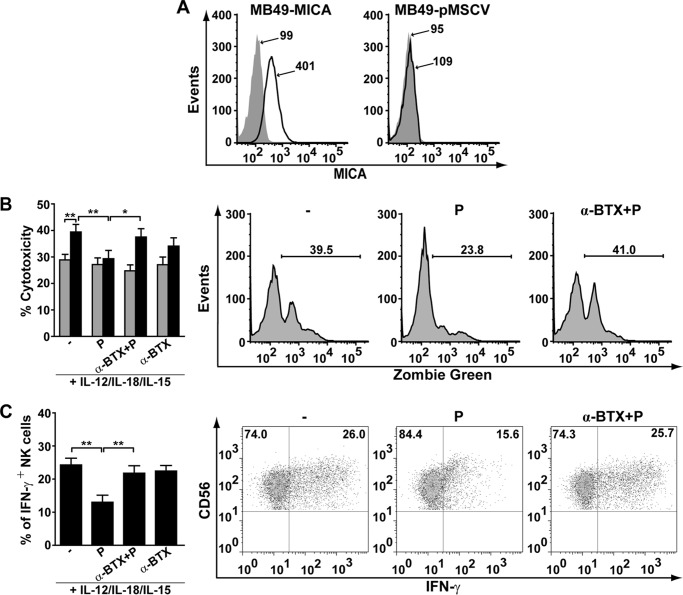
Activation of α7 nAChR decreases NK cell-mediated cytotoxicity and IFN-γ production. A, expression of MICA in MB49 cells. MB49 were transduced with a retroviral vector encoding MICA*008 (left panel) or with empty vector (right panel). Gray histogram, IC mAb; black line, MICA-specific mAb. Numbers within histograms represent the MFI for MICA in each condition. B and C, human NK cells were stimulated for 48 h with IL-12/IL-18/IL-15, and further cultured for 18 h with cytokines in the absence (−) or presence of PNU-282987 (P), α-BTX and PNU-282987 (α-BTX + P) or α-BTX alone (α-BTX). Thereafter, cytotoxic activity and IFN-γ production by NK were assessed. B, NK cell-mediated cytotoxicity was assessed after co-culture for 5 h with MB49 cells transduced to stably express MICA on the cell surface (MB49-MICA, black bars) or its corresponding negative control (MB49-pMSCV, gray bars) as explained under “Experimental Procedures.” Data are shown as mean ± S.E., and are cumulative of at least three independent experiments performed with NK cells from different donors (n = 6). Representative histograms of the assays with MB49-MICA cells are shown on the right. Numbers within histograms, percentage of positive cells for Zombie Green in each condition. *, p < 0.05; **, p < 0.01; two-way ANOVA test with Sidak post hoc test. C, production of IFN-γ by NK cells was assessed by FC as explained under “Experimental Procedures.” Data are shown as mean ± S.E., and are cumulative of three independent experiments performed with NK cells from different donors (n = 5). Representative dot plots of NK cells (CD56+) stimulated with IL-12/IL-18/IL-15 cultured in the absence (−) or presence of PNU-282987 or α-BTX + PNU-282987 are shown on the right. **, p < 0.01; one-way ANOVA test with Bonferroni post hoc test.

