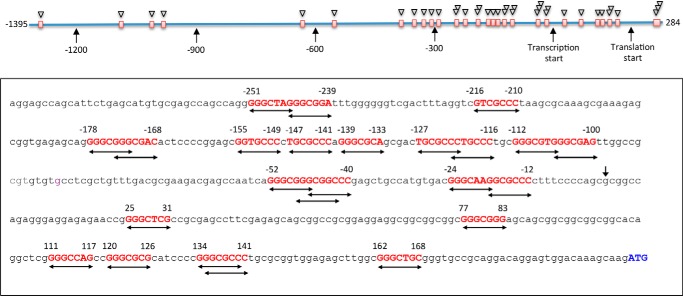
FIGURE 2.
Analysis of the CerS6 promoter for the presence of p53-binding sites. Full-length CerS6 promoter sequence was analyzed using Promo 3.0.2 online tool. Putative p53 response elements are shown in red; predicted binding sites are indicated by double-arrow lines. The transcription start site is indicated by vertical arrow. The translation start in exon 1 (ATG) is shown in blue. The diagram on the top indicates positions of the putative p53 response elements (red squares). Triangles indicate number of binding sites within a contiguous sequence.

