FIGURE 1.
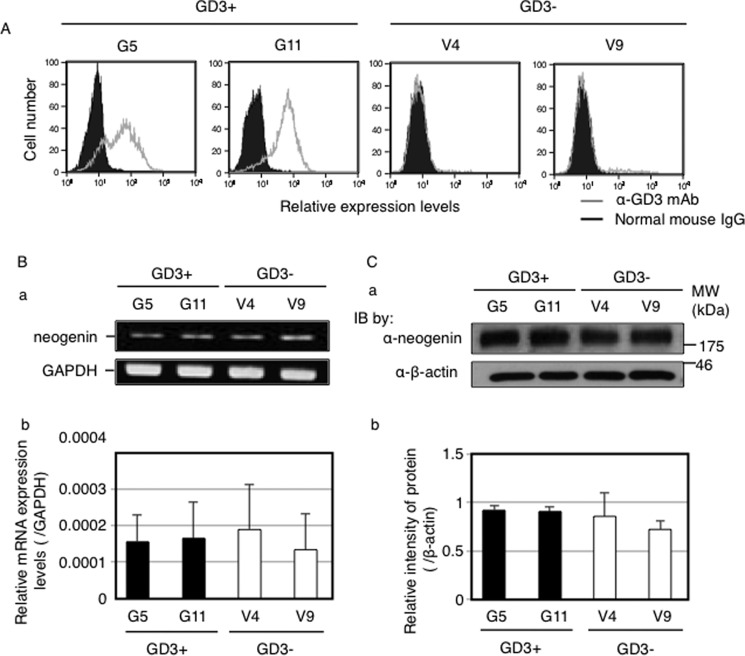
Neogenin expression was equivalent among all GD3+ cells and control cells. A, GD3 expressions on GD3+ cells (G5, G11) and control cells (V4, V9). Cells (3 × 10⁵) were incubated with anti-GD3 mAb (R24) for 1 h at 4 °C. After washing with PBS, cells were incubated with an FITC-labeled anti-mouse IgG antibody for 45 min at 4 °C. Then GD3 expression levels were analyzed using FACS CaliburTM. Gray lines indicate staining with an anti-GD3 antibody. Black lines with solid peaks indicate the staining with normal mouse IgG. B, mRNA expression mRNA levels of neogenin in GD3+ cells (G5, G11) and control cells (V4, V9) examined by RT-PCR. a, PCR products were observed by agarose gel electrophoresis. b, quantitative PCR analysis was performed. Expression mRNA levels of neogenin was normalized by the GAPDH gene (n = 3). C, protein expression levels of neogenin in GD3+ cells (G5, G11) and control cells (V4, V9) examined by Western blotting. a, total 12.5 μg of proteins were separated in SDS-PAGE. After blotting onto PVDF membranes, membranes were incubated with an anti-neogenin antibody (upper panel) or an anti-β-actin antibody (lower panel). IB, immunoblot. b, the intensities of bands in a were measured by Image JTM software and plotted. The intensities of bands of neogenin were normalized by β-actin (n = 3).

