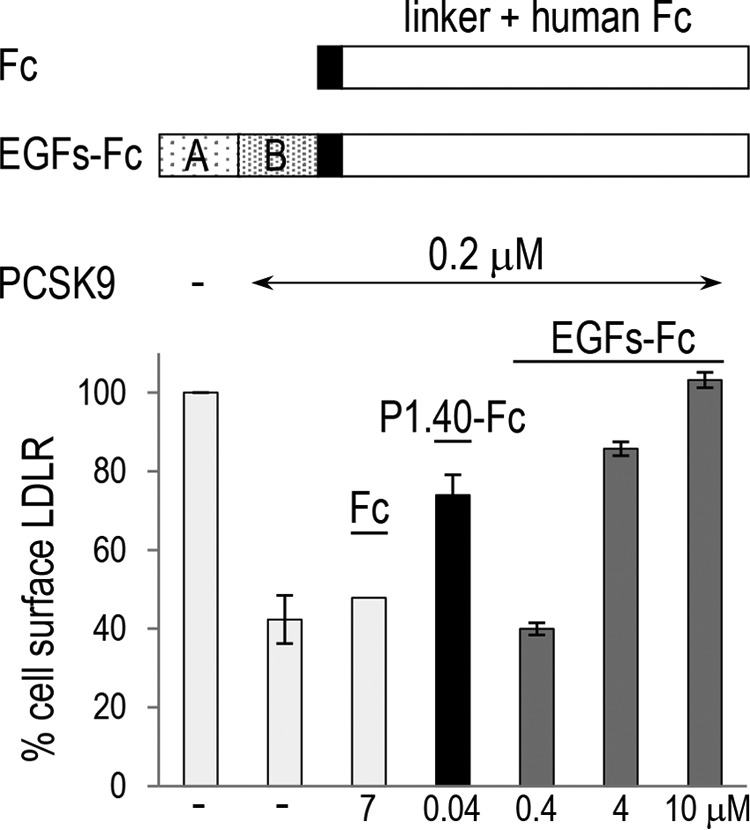
FIGURE 6.

Comparison of the inhibitory activity of the sdAb P1.40 and EGF-AB fused to Fc domains. The primary structure of the Fc alone or EGF-AB fusion is shown. HepG2 cells were incubated for 4 h in the absence (−) or presence of 0.2 μm (15 μg/ml) WT PCSK9 mixed with 7 μm control linker + Fc (Fc), 0.04 μm sdAb P1.40, or 0.4–10 μm of EGFs + Fc. Cells were then analyzed by FACS for cell surface LDLR levels. The average values of two independent experiments are shown, except for Fc (n = 1).
