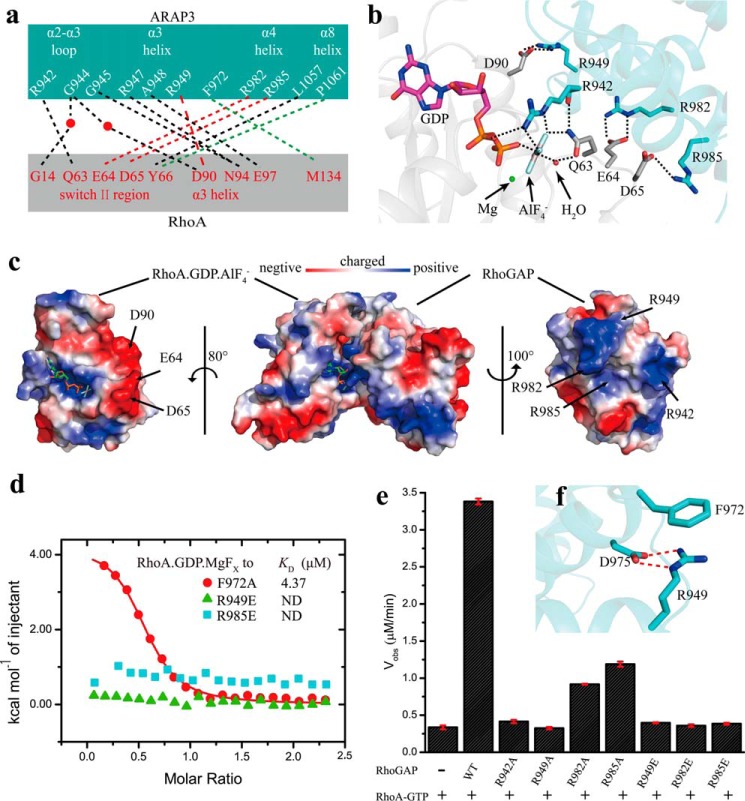
FIGURE 2.
Interaction surface between the ARAP3-RhoGAP domain and RhoA. a, schematic representation of interacting residues. Hydrogen bonds, salt bridges, and hydrophobic interactions are shown with black, red, and green dashed lines, respectively. Water is shown as a red ball. b, zoomed-in view of the electrostatic interaction surface with interacting residues displayed as sticks. c, structure of ARAP3-RhoGAP·RhoA·GDP·AlF4− is shown with electrostatic potential surface, in which blue, red, and white represent positively charged, negatively charged, and neutral areas, respectively. d, ITC fitting curves of different point mutants of the ARAP3-RhoGAP domain to RhoA·GDP·MgFx. e, GTPase assay results of 20 nm wild type ARAP3-RhoGAP domain and its mutants to 35 μm RhoA-GTP at 293 K, measured by MESG/PNP system. f, Arg-949 stabilizes the structure of the ARAP3 RhoGAP domain though salt bridges (red dashed lines) interactions with Asp-975 and cation-π interactions with Phe-972. The error bars represent the standard deviation from three independent experiments.

