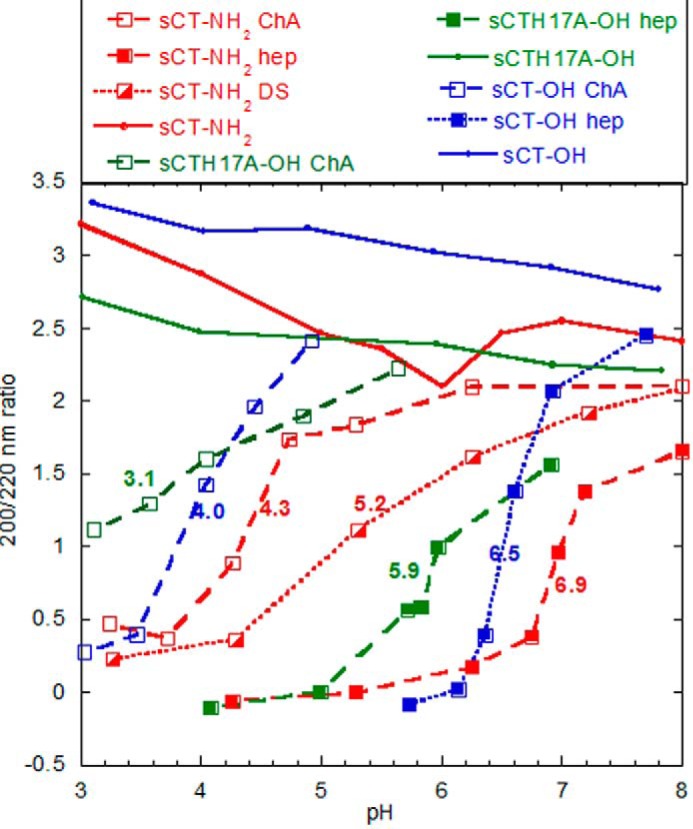
FIGURE 3.

Charge and pH affect binding of GAGs to sCT. sCT binding to GAGs is shown as a function of pH monitored by CD. sCT alone had 200:220 ratios between 2.2 and 3.2 in the entire pH range (solid lines). Shown are sCT-NH2 in red, sCT-OH in blue, and sCTH17A-OH in green with heparin (filled symbols), DS (half-filled symbols), and ChA (open symbols). The samples contained 0.2 mg/ml sCT, 0.2 mg/ml GAG, and 20 mm citrate-phosphate buffer at the indicated pH values. The colored numbers in the graph are visual estimates of the pH midpoint of titration for the seven individual titration curves, which transition from random coil (high pH) to highly helical (low pH). The baseline values for the random coil are estimated from the GAG-free sCT variants at high pH, whereas the helix value is estimated to be around −0.2 based on the convergence of CD values at low pH. These values are merely used for comparative purposes (see main text).
