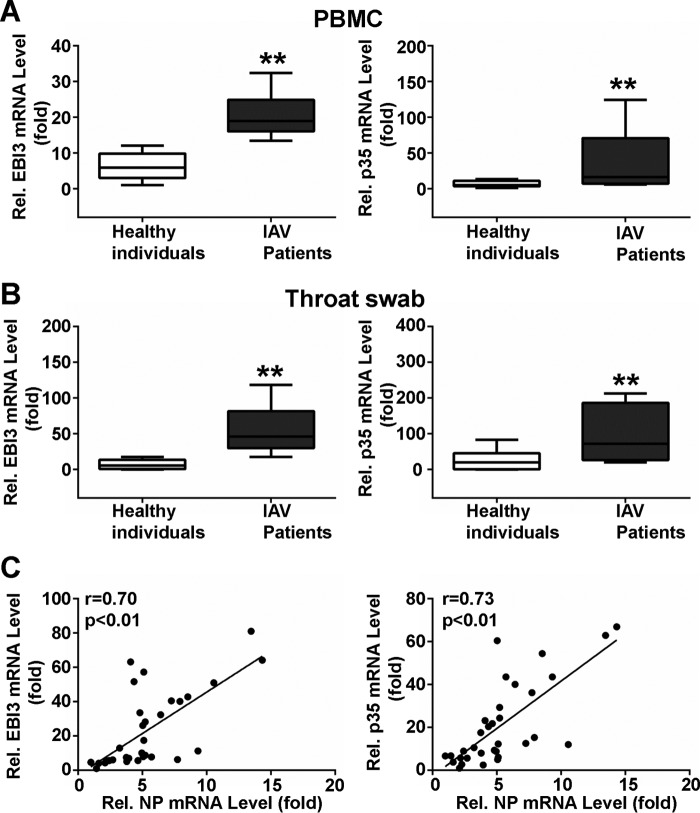
FIGURE 1.
Measurement of IL-35 in IAV-infected patients and healthy individuals. A, total RNA was extracted from freshly isolated PBMCs from healthy individuals (n = 12) or IAV-infected patients (n = 12). EBI3 (left) and p35 (right) mRNA was quantified using qPCR. B, throat swab EBI3 (left) and p35 (right) mRNA levels in controls (n = 10) and patients (n = 10). In A and B, the lowest value from controls was as assigned a value of 1. Data are expressed as -fold induction (folds) relative to the lowest value from controls. Data are expressed as the mean ± S.E. from samples tested in triplicate. Boxplots illustrate medians with 25 and 75%, and error bars for 5 and 95% percentiles (**, p < 0.01). C, correlation analysis between NP mRNA and EBI3 (left, n = 33) and p35 (right, n = 33) mRNA levels in PBMCs from IAV-infected patients. Solid line, linear growth trend; r, correlation coefficient; Pearson correlation analysis was used to determine r values; Student's t test was used to determine p values.

