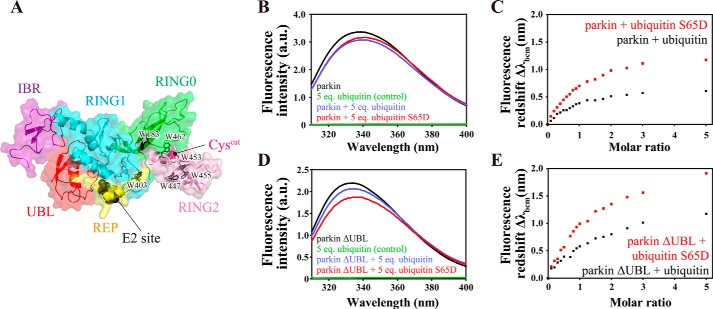
FIGURE 5.
Structural changes in the parkin core upon ubiquitin binding. A, distribution of tryptophan residues in rat parkin. Pink sphere, catalytic cysteine. B, changes in the tryptophan emission spectrum of full-length parkin upon binding to ubiquitin. C, red shift of the baricentric mean of the fluorescence emission spectrum as a function of the molar ratio of ubiquitin to parkin. D, changes in the tryptophan emission spectrum of parkin ΔUBL upon binding to ubiquitin. a.u., arbitrary unit. E, red shift of the baricentric mean of the fluorescence emission spectrum as a function of the molar ratio of ubiquitin to parkin ΔUBL.

