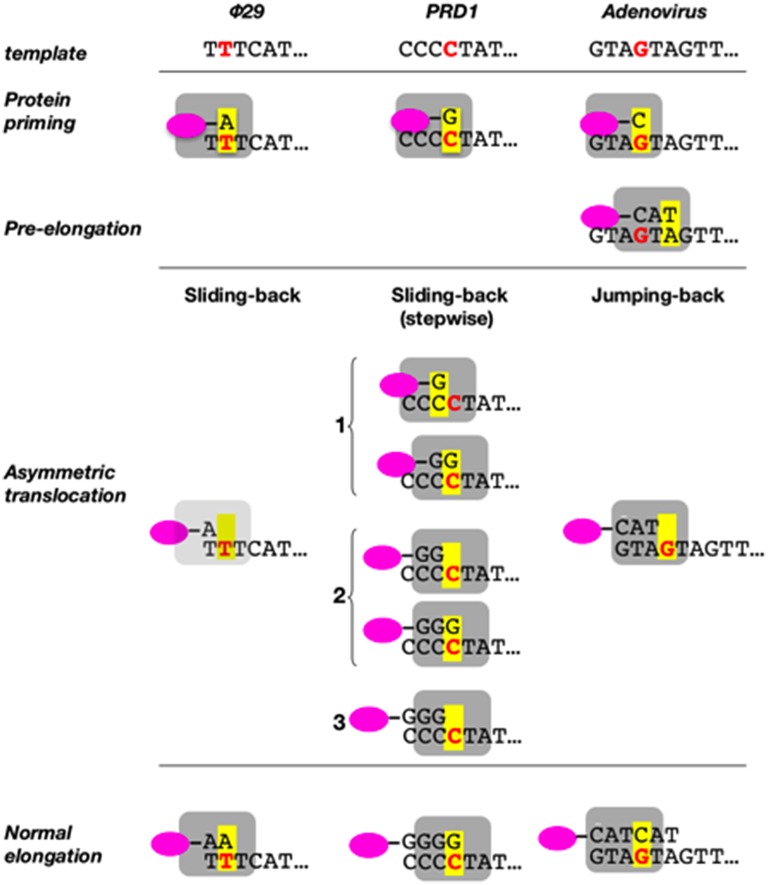
Figure 7.
Sliding-back (jumping-back) model for the transition from initiation to elongation. TP is represented as a pink oval and DNA polymerase as a gray square. The internal template nucleotide that directs the insertion of the initial nucleotide is shown in bold red letter. Yellow box represents the catalytic active site of the DNA polymerase. Reproduced from de Vega and Salas (2011).

