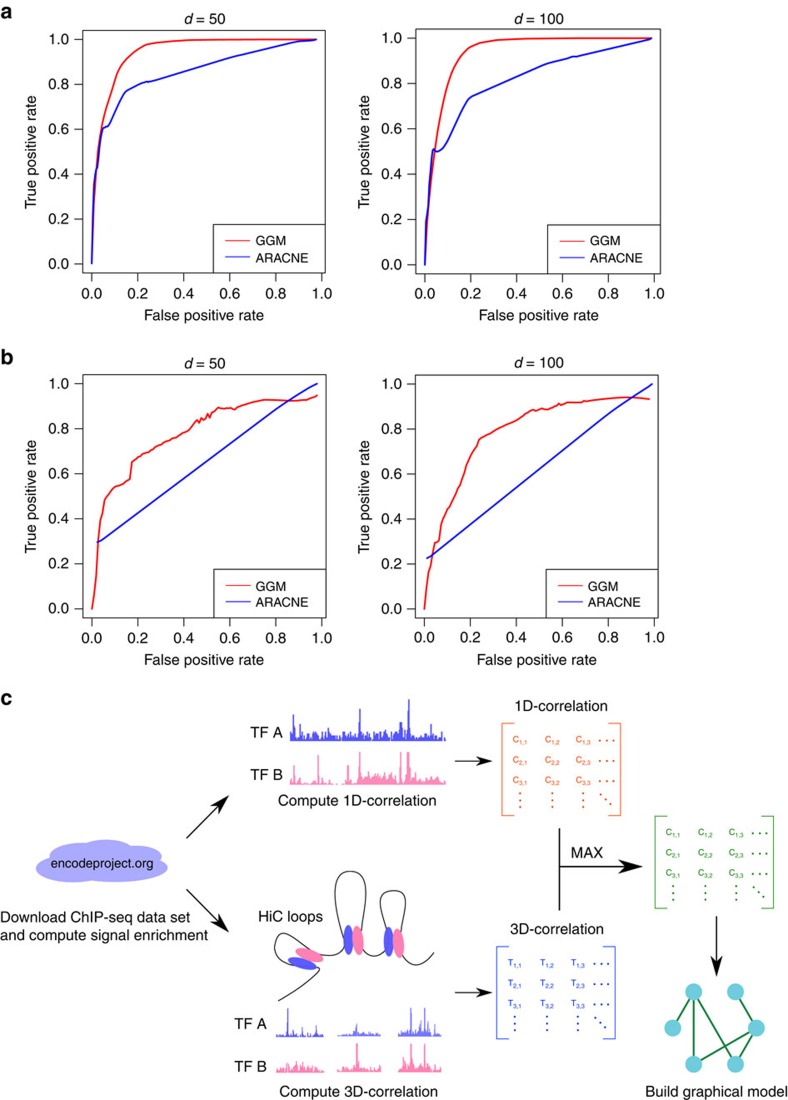
Figure 1. The performance of the GGM is consistently better than ARACNE.
Each plot shows the average curve from 10 independent simulations. (a) ROC curve for samples generated from random networks. For each simulation 500 (left) or 1,000 (right) samples were generated from a network of 50 (left) or 100 (right) nodes. (b) ROC curve for samples generated from yeast sub-networks. For each simulation 500 (left) or 1,000 (right) samples were generated from a network of 50 (left) or 100 (right) nodes. (c) Workflow of the DBPnet pipeline.

