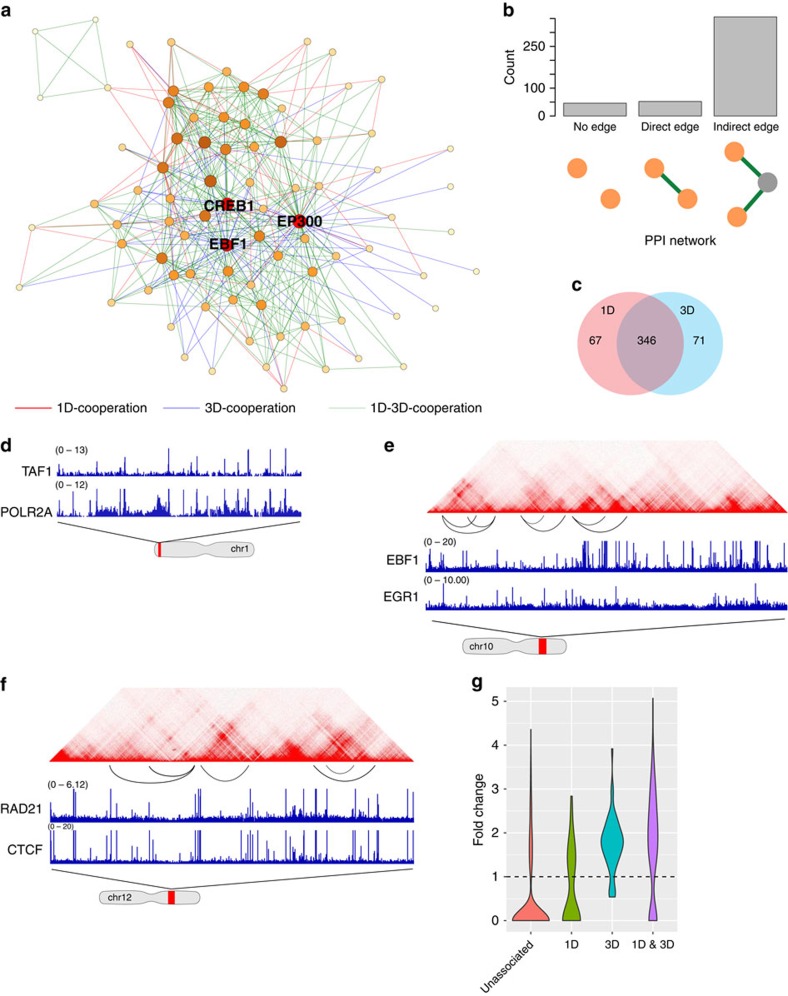
Figure 2. Constructing the DBP cooperation network in GM12878.
(a) DBP cooperation network in GM12878, with network hubs (EP300, EBF1, CREB1) being highlighted. (b) A significant portion of DBP cooperation is supported by evidence of direct protein–protein interactions. (c) The majority of DBP cooperation is a mixture of 1D and 3D cooperation. (d) An example of 1D-cooperation. (e) An example of 3D-cooperation. (f) An example of mixed cooperation. (g) Disease-associated genotype variations are enriched in 1D-dominant (n=67), 3D-dominant (n=71) and 1D–3D cooperative (n=346) sites.

