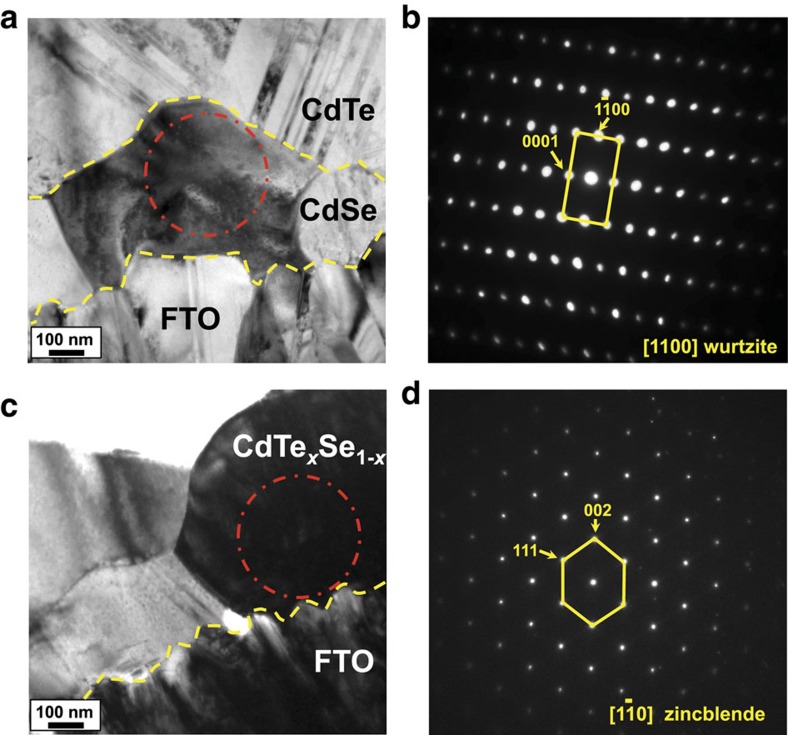
Figure 4. CdTe growth-induced phase transformation.
(a–d) BF-TEM images and SAD patterns of structures associated with the FTO/CdSe/CdTe interfaces. The yellow-dashed lines designate the FTO, CdSe and CdTe interfaces for each sample. (a) BF-TEM image of the FTO/CdSe/CdTe structure for the cell with a 400 nm-thick CdSe layer. (b) TEM-SAD pattern acquired from the grain region outlined with a red dashed circle in a. The SAD pattern is indexed as [1100] for the CdSe wurtzite phase. (c) BF-TEM image of the FTO/CdTexSe1−x region for the cell with a 100 nm-thick CdSe layer. (d) TEM-SAD pattern acquired from the grain region outlined with a red dashed circle in c. The SAD pattern is indexed as  for the CdTexSe1−x zincblende phase.

