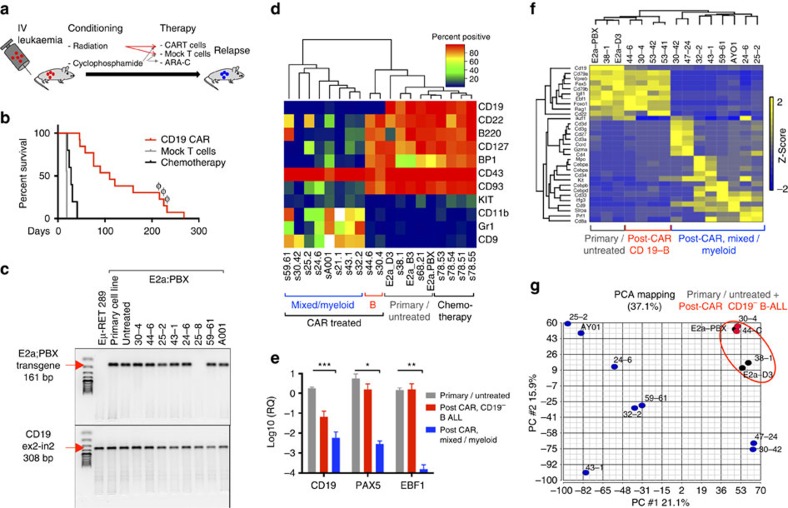
Figure 2. Distinct phenotypic and genomic alterations in pre-B cell induced by CD19 CAR pressure in vivo.
(a) Schematic design of in vivo murine experiments: mice were injected with leukaemia, followed by lymphodepletion (5 Gy radiation or 4 mg cyclophosphamide) and adoptive T-cell therapy (CAR/Mock T cells) or chemotherapy (4 mg per mouse cyclophosphamide on day 4 followed by 2.5 mg ARAC on days 5 and 10). (b) Survival curve of mice treated with chemotherapy (black, n=5), mock T cells (blue, n=9) or CD19 CAR T cells (red, n=13). Samples marked with φ had no E2a:PBX transgene on PCR and were not further analysed. (c) PCR for E2a:PBX transgene of Eμ-RET cells (negative control), E2A:PBX parental cell line, and splenocytes harvested from leukaemic mice treated with CD19 CAR. CD19 gene (exon2–intron2) was used as control for DNA quantity. (d) Primary and post-CAR relapse leukaemia was analysed by multicolour flow cytometry. Heatmap representing percent of positive cells for multiple lineage markers for each sample. Unsupervised hierarchical clustering is shown above. Mouse IDs as in Supplementary Table 1 are reported below. (e) Quantitative RT PCR for CD19, PAX5 and EBF1 mRNA in primary E2a:PBX leukaemia or mock-treated relapse (n=7, grey), post-CAR CD19− B-ALL relapses (n=2, red) and post-CAR mixed/myeloid relapses (n=7, blue). Data represented as fold change in gene expression over GAPDH, error bars represent s.e.m. *P<0.05, **P<0.01, ***P<0.001 (f) Heatmap demonstrating changes in gene expression of selected hematopoietic transcripts measure by RNA sequencing. Unsupervised clustering is shown above. (g) Principal component analysis of RNA sequencing data from primary and post-CAR samples. Red circle indicates clustering of primary and early-post-CAR samples.

