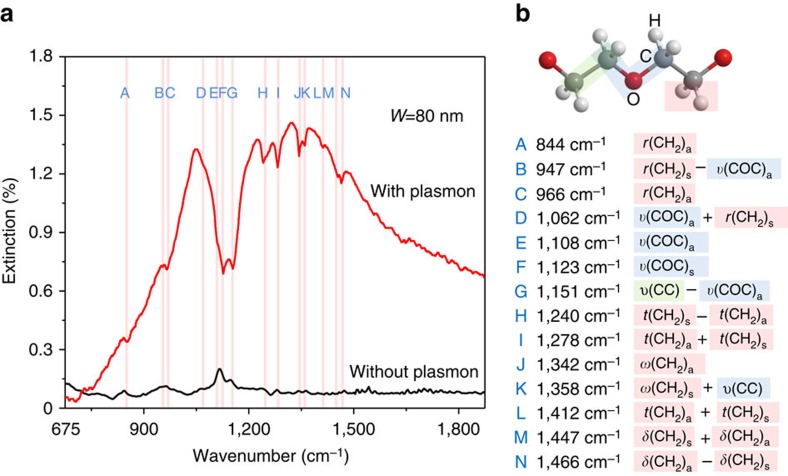
Figure 3. Highly sensitive detection of molecular vibrational fingerprints.
(a) A comparison of the sensing results for an 8-nm-thick PEO film with (red curve) and without (black curve) graphene plasmon enhancement. The corresponding Fermi level is ∼0.2 eV. The red vertical lines indicate various PEO molecular vibrational modes. (b) The list of PEO vibrational modes in the molecular fingerprint region and their positions in a. The green, blue and red backgrounds represent the C–C, C–O–C, and methylene groups, respectively. The prefixes r, υ, ω and t indicate rocking, stretching, wagging and twisting modes, respectively. The suffixes s and a imply symmetric and anti-symmetric modes, respectively, with respect to the two-fold axis perpendicular to the helix axis and passing through the oxygen atom or center of the C–C bond. The + and − signs denote the phase relationship for the potential energy distribution of the coupled coordinates.

