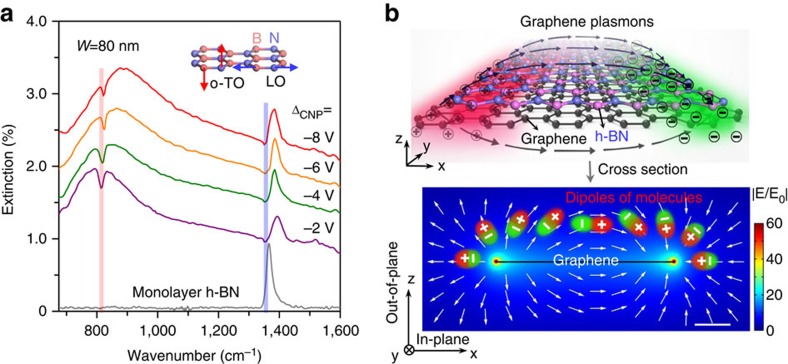
Figure 5. Simultaneous detection of in-plane and out-of-plane vibrational fingerprints.
(a) The extinction spectra (coloured lines) of the graphene plasmon sensor covered with an h-BN monolayer. The infrared extinction spectrum (grey line) of monolayer BN is obtained with incident light normal to the h-BN basal plane. The vertical lines indicate the positions of the optical phonon modes of h-BN monolayer. Inset: the out-of-plane (the transverse optical phonon mode at ∼820 cm−1, o-TO) and in-plane (the longitudinal optical phonon mode at ∼1,370 cm−1, LO) modes in h-BN. (b) A schematic diagram of the interaction between the electric field of the graphene plasmon and monolayer h-BN structure vibrations. The red and green colours in the upper figure indicate the snapshot of positive and negative charge distribution of graphene plasmon. The black arrows represent graphene plasmon. The lower part shows the side view of the electric field intensity distribution calculated from 100 nm wide graphene nanoribbons with EF=0.3 eV, obtained from a finite element electromagnetic simulation. White arrows indicate the relative direction of the distribution of electric field of graphene plasmon and the response of molecular vibrations to the plasmonic electric field is illustrated by dipoles. The colour bar indicates the field confinement of graphene plasmon, while E0 is the electric field intensity of incident light. Scale bar, 20 nm.

