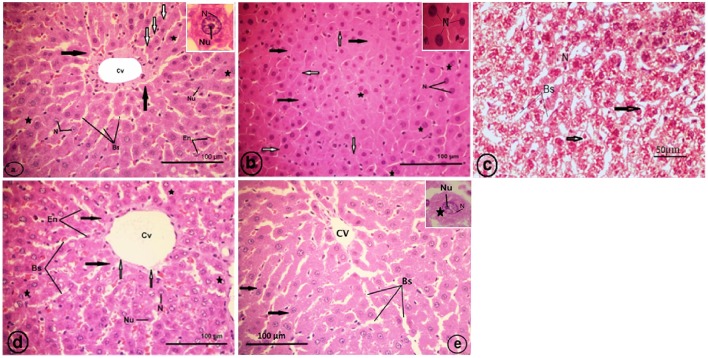
Figure 7.
Light micrographs showing a liver section of rat (Two histological slides from each block from each rat were stained with hematoxylin and eosin; n = 10). (A) Control liver showing no abnormality, the liver section showing a classic hepatic strands (white arrows) with hepatocytes (asterisk) of control rat separated by blood sinusoids (Bs); central vein (Cv); endothelial cell (En) of blood sinusoid. Inset: a hepatocyte with finely granular cytoplasm (black arrows); euchromatic nucleus (N) and prominent nucleolus (Nu). (B) CCl4 treated group, showing degranulation of hepatocytes cytoplasm (black arrows); collapsed blood sinusoids (white arrows); an increase of binucleated hepatocytes (asterisks). Inset: pyknotic nuclei (N) of hepatocytes. (C) CCl4 treated group, showing vacuolated narrow irregular strands of hepatocytes (arrows) with compressed cytoplasm against plasma membranes, clumped outside the nucleus (N); blood sinusoids (Bs). (D) Showing classical hepatic plates (black arrows) of strawberry administrated group; blood sinusoids (Bs); central vein (Cv); endothelial cell (En) of sinusoids; hepatocytes (asterisks) with finely granular cytoplasm, euchromatic nuclei (N) and prominent nucleoli (Nu). (E) Showing recovery of the hepatic plates (arrows) of CCl4 and strawberry treated group separated by blood sinusoids (Bs); central vein (Cv).

