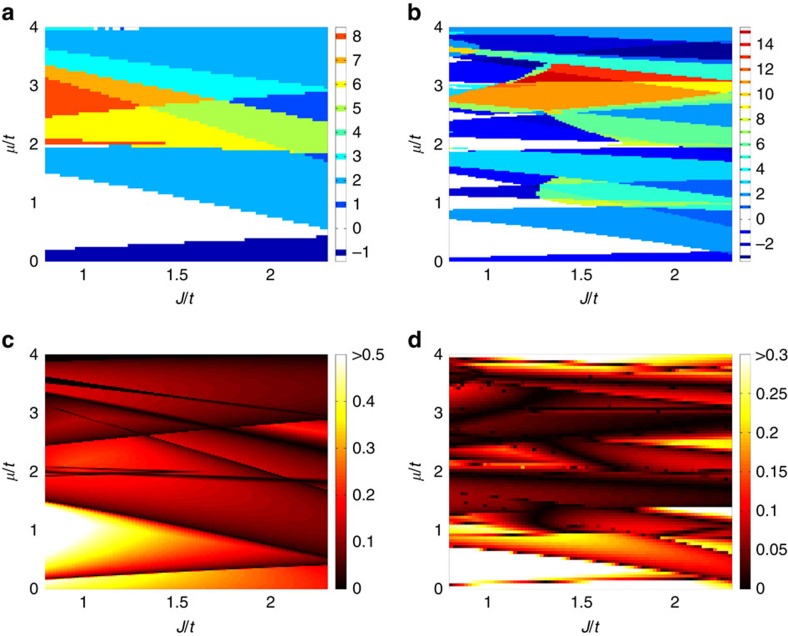
Figure 2. Phase diagrams in the dense impurity limit.
(a,b) Chern numbers, and (c,d) ratios of the induced superconducting gap to the host superconducting gap, as functions of the chemical potential μ and the exchange field strength J, both in units of hopping strength t. (a) and (c), (b) and (d) correspond to the case of one magnetic adatom every 2 × 2, or 3 × 3 lattice sites, respectively. These phase diagrams are obtained by using the Hamiltonian in equation (1) with Δ=0.06t and α=0.1t; μ has been shifted such that μ=0 implies the chemical potential lying in the center between the two spin-split band bottoms.

