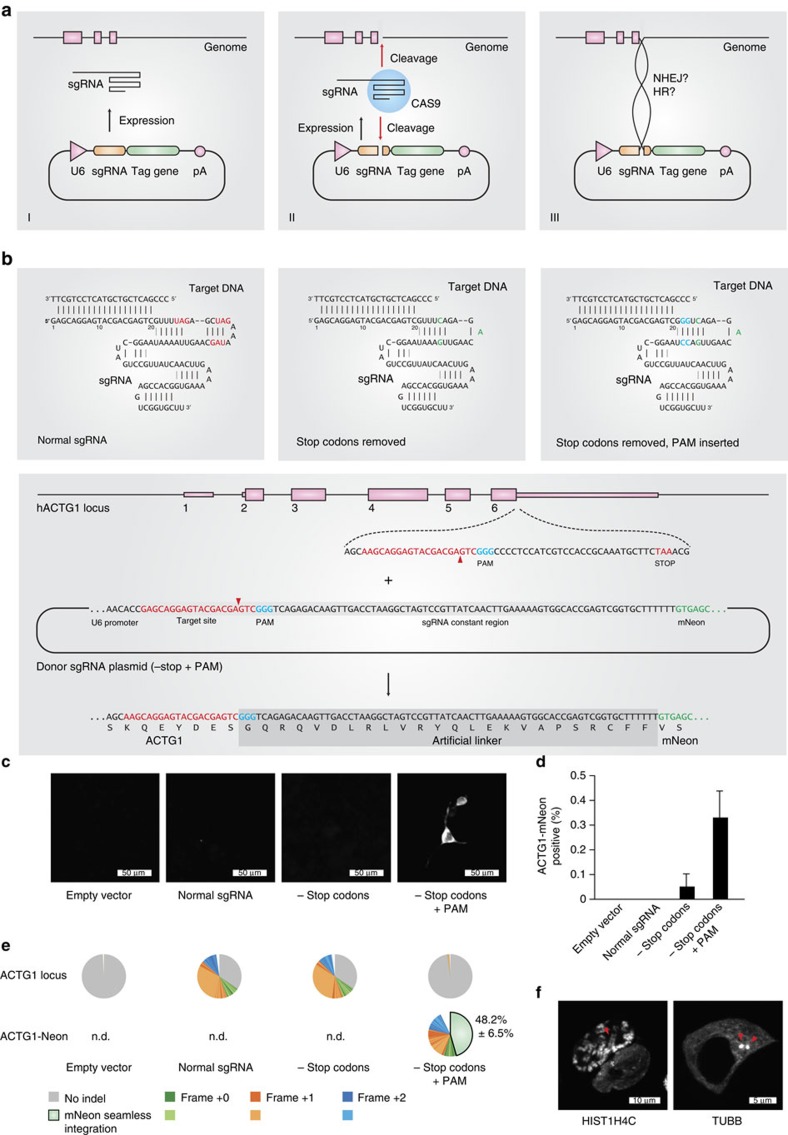
Figure 1. Self-cleaving sgRNA plasmid integration.
(a) Three steps of a self-cleaving plasmid integration system. I, an sgRNA is expressed from an sgRNA plasmid under the control of a U6 promoter. II, in conjunction with Cas9 protein, the sgRNA cleaves the coding region of a target gene as well as the sgRNA plasmid itself. III, the generated DNA ends of genomic and plasmid DNA are intended to be ligated by the cellular NHEJ or HR machinery, resulting in the genomic integration of the full-length plasmid. (b) To allow tag expression after integration of a plasmid according to a, stop codons in the constant part of the sgRNA sequence have to be removed. Left panel, normal sgRNA sequence with stop codons in red. Middle panel, stop codons have been removed, base changes in green. Right panel, a PAM motif (blue) has been introduced into the sgRNA sequence to allow efficient cleavage of the sgRNA plasmid. Lower panel, exemplary sequences for tagging the human ACTG1 gene using a −stop+PAM construct. (c) Microscopic images of HEK 293 cells transfected with different integration plasmids. (d) Image quantification of ACTG1-mNeon-positive cells. Shown are mean values+s.e.m. from three independent biological replicates. (e) Deep sequencing analysis of random genomic editing events using primer pairs spanning the targeting region (upper pie charts) and mNeon integration events using primer pairs upstream of the targeting region and within the mNeon gene (lower pie charts). Frame shifts are colour-coded as indicated. The shades of each colour allow to distinguish individual indel events (see legend). Shown are representative results of one out of three independent biological replicates. The percentages indicated are mean values+s.e.m. from three independent biological replicates. ND, not determined. (f) Confocal images of HEK 293 cells transfected with targeting constructs for the human HIST1H4C and TUBB genes. Red arrows indicate an individual chromosome (left panel) or the microtubule-organizing center (right panel).

