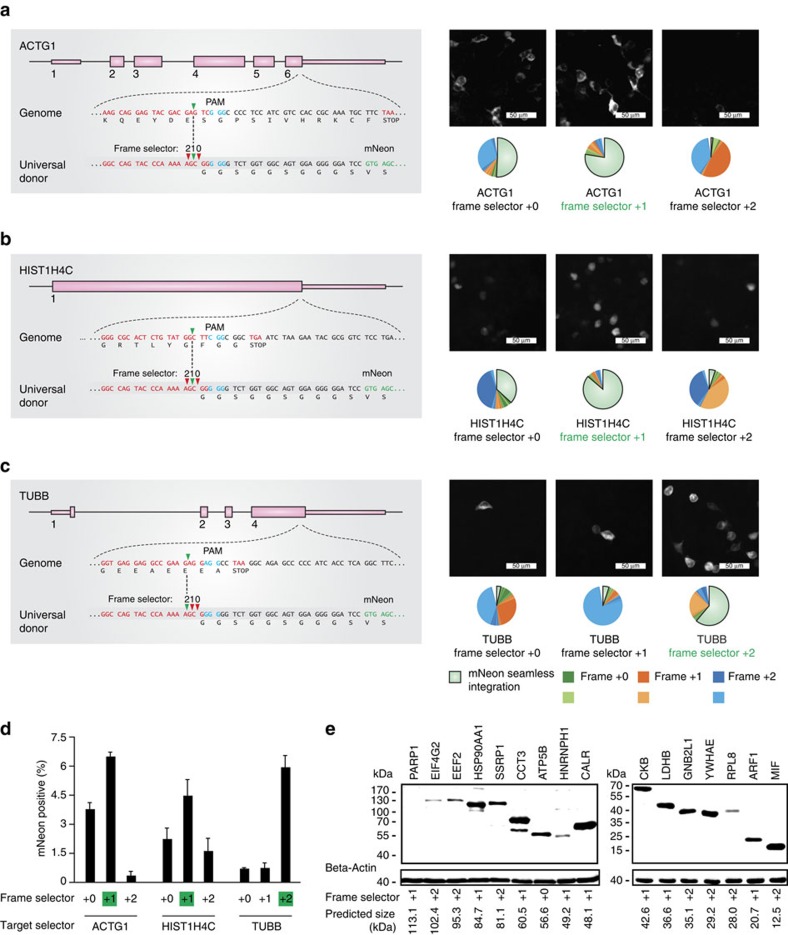
Figure 3. Flexible frame selection of CRISPaint gene tagging.
(a–c, left panels) Scheme of the exon structure of three genes targeted by CRISPaint. (a–c, right panels) Fluorescence imaging and deep sequencing analysis of ACTG1-mNeon (a) HIST1H4C-mNeon (b) and TUBB-mNeon (c) gene tagging using different frame selector plasmids. The frame selector predicted for in-frame tagging is marked in green. (d) Image quantification of mNeon tagging-positive cells. Shown are mean values+s.e.m. from three independent biological replicates. (e) Immunoblotting result of CRISPaint-mediated tagging of 16 human genes with a 3 × FLAG tag. Indicated below are the predicted protein sizes and frame selectors used.

