FIGURE 3.
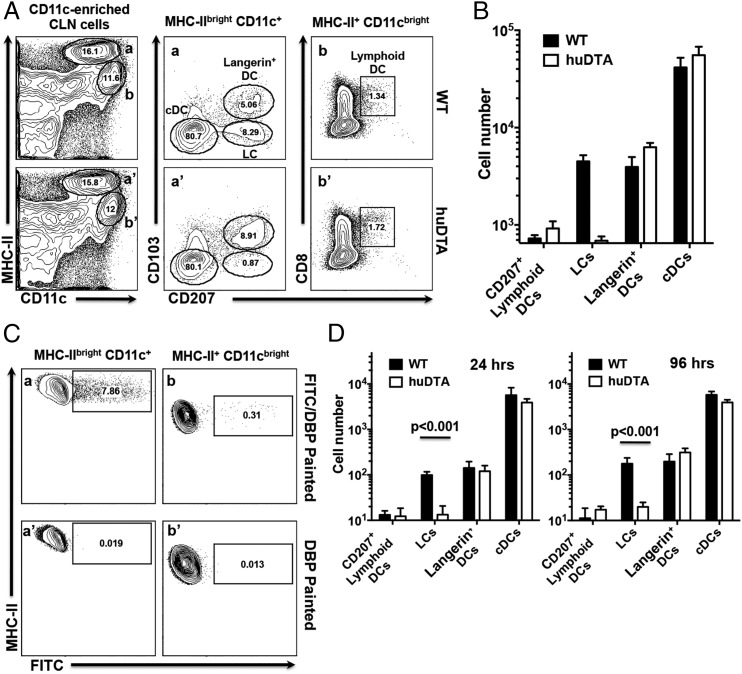
Migration of DC subsets to CLNs under steady-state and inflammatory conditions is not inhibited in LC-deficient huLangerin-DTA (huDTA) mice. Single-cell suspensions prepared from CLNs harvested from C57BL/6J (wild-type [WT]) and huDTA mice were enriched for CD11c+ cells, stained with anti-mouse CD11b, CD11c, I-Ab (MHC-II), CD103, EpCAM, CD8α, CD207, CD3, and B220 flurochrome-conjugated mAbs, and analyzed by flow cytometry to identify LCs and DC subsets. (A) Flow cytometry gating strategy used to identify DC subsets within CLNs. Representative dot plots for a WT and huDTA mouse are shown. Migratory (gates a and a′) and lymphoid-resident (gates b and b′) DCs were identified as MHC-IIbrightCD11c+CD3−B220− or MHC-II+CD11cbrightCD3−B220− populations, respectively. Migratory DCs were further divided into populations of cDCs (CD103−CD207−), LCs (CD103−CD207+), and Langerin+ DCs (CD103+CD207+) based on the differential expression of CD207 and CD103 (panels a and a′). Lymphoid-resident DCs expressing CD207 were identified based on expression of CD8α and CD207 (panels b and b′). Numbers within individual gates refer to percentage of cells in the parent gate. (B) Total number of cDCs, LCs, Langerin+ (CD207+) and CD207+ lymphoid-resident DCs found in CLNs of WT and huDTA mice. Total numbers of each subpopulation were determined from pre-enrichment sample aliquots stained to identify MHC-IIbrightCD11c+CD3−B220− and MHC-II+CD11cbrightCD3−B220− cells coupled with percentage of cells found in each subpopulation gate after enrichment. Data pooled from two independent experiments (WT, n = 5; huDTA, n = 6) were compared using a two-tailed Student t test and are presented as mean ± SEM. (C) Representative flow cytometry dot plots showing FITC signal on MHC-IIbrightCD11c+CD3−B220− (panels a and a′) and MHC-II+CD11cbrightCD3−B220− (panels b and b′) CLN cell populations following application of FITC/DBP or DBP to mouse gingiva 24 h earlier. (D) Summary of FITC+ DC populations found in CLNs of WT and huDTA mice painted with FITC 24 or 96 h earlier. CLNs were harvested and single-cell suspensions were enriched, stained, and analyzed by flow cytometry to identify specific DC subpopulations as described in (A). Data from two independent experiments of at least five mice in each group were compared using a two-tailed Student t test and presented as mean ± SEM.

