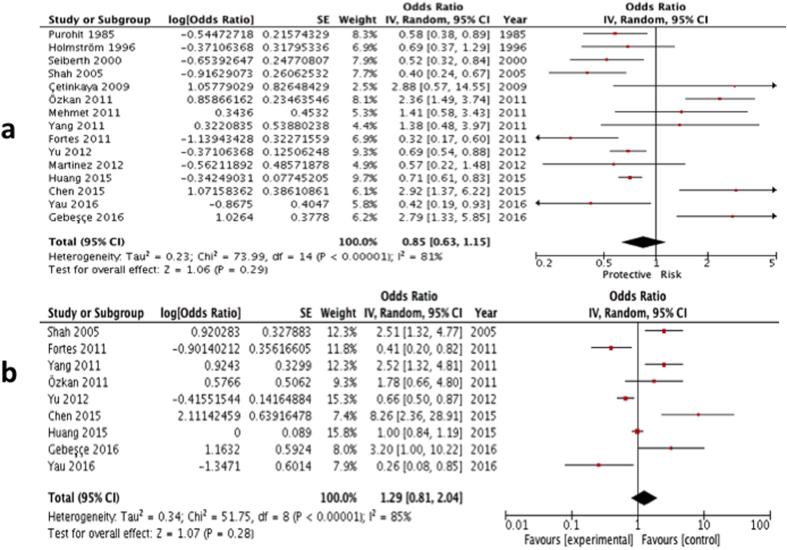
Figure 3.
(a) Forest plot for univariate analysis of 15 studies examining the effect of PET only exposure on ROP (any type). The bars with squares in the middle represent 95% confidence intervals (95% CIs) and odds ratios (ORs). The central vertical solid line indicates the ORs for null hypothesis. (b) Forest plot for multivariate analysis of 9 studies examining the effect of PET only exposure on ROP (any type). The bars with squares in the middle represent 95% confidence intervals (95% CIs) and odds ratios (ORs). The central vertical solid line indicates the ORs for null hypothesis.

