
Figure 7. Expression analyses of NAC TFs in the roots of watermelon exposed to ABA and JA.
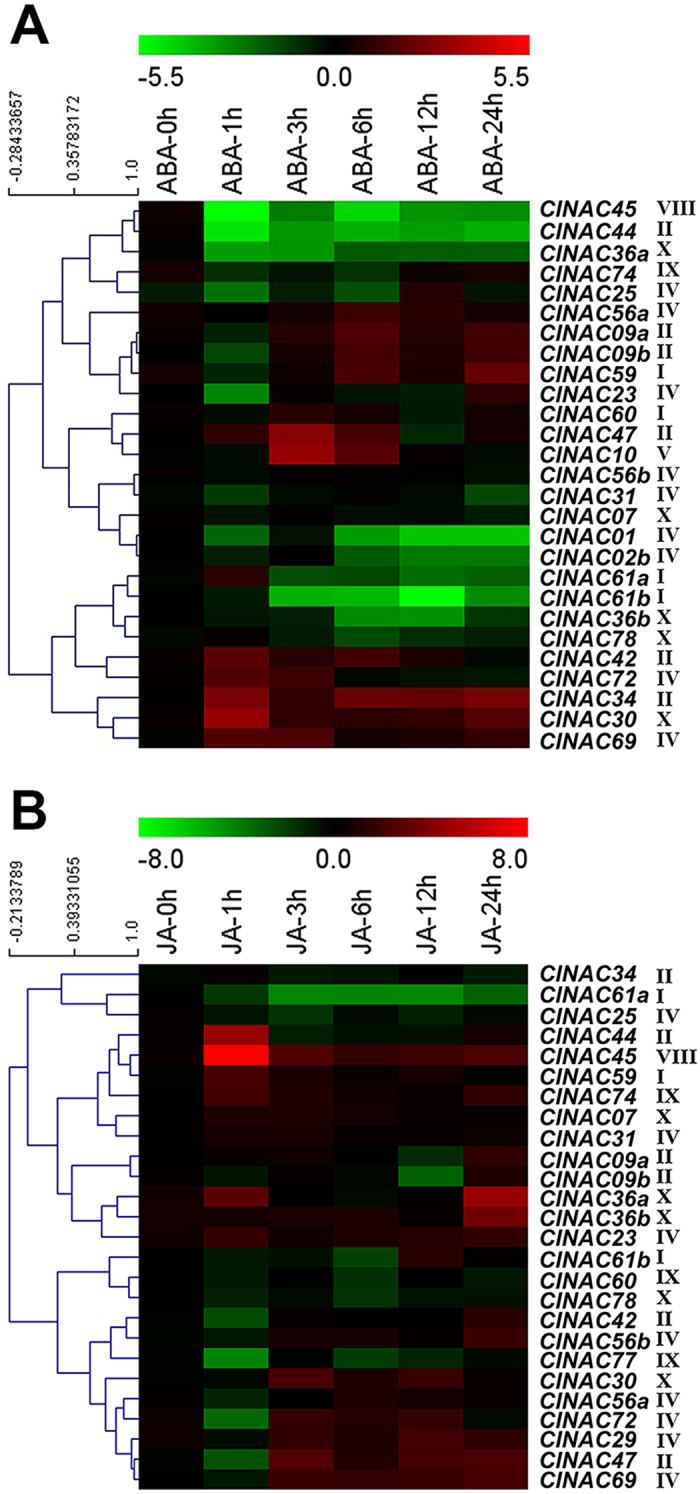
(A) Expression analysis of NAC TFs in the roots of watermelon exposed to ABA. (B) Expression analysis of 24 NAC TFs in the roots of watermelon exposed to JA. The scale representing the relative signal intensity values is shown above. Hierarchical clustering was used in the data analysis.