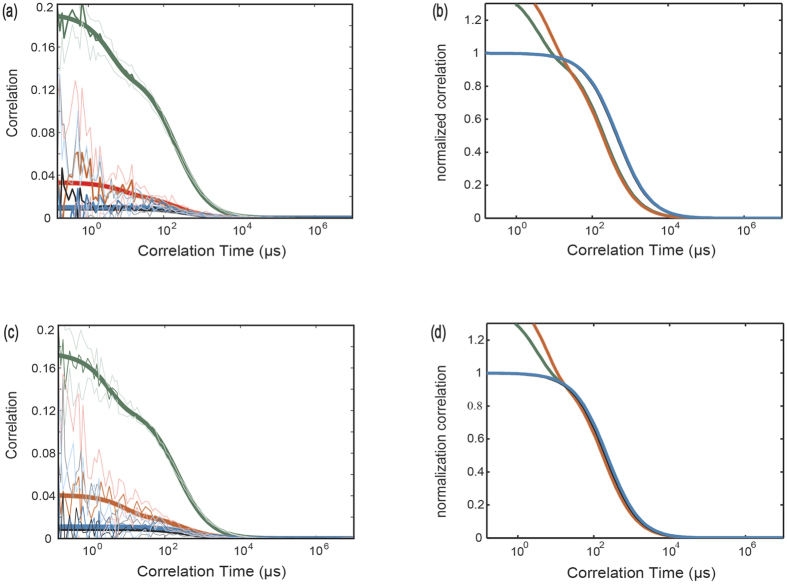
Figure 2. FCCS data for apo and saturated DPC (Ykt6:DPC = 1:2) conditions (green: AC-d; red: AC-a; black: CC-da; blue: CC-ad).
(a) Raw FCCS time correlation function data of rYkt6ΔC (all FCCS experiments are done on samples labeled with Alexa 488/647 FRET pairs) in the apo environment free of DPC. The thin fluctuated lines are the original data, the bold coloured curves are smoothed by increasing the number of binsize in triplet, whereas the thick lines indicate the fitted curves. (b) Normalized FCCS data of rYkt6ΔC in the apo environment free of DPC. (c) Raw FCCS data of rYkt6ΔC in the environment of Ykt6:DPC = 1:2. (d) Normalized FCCS data of rYkt6ΔC in the environment Ykt6:DPC = 1:2.

