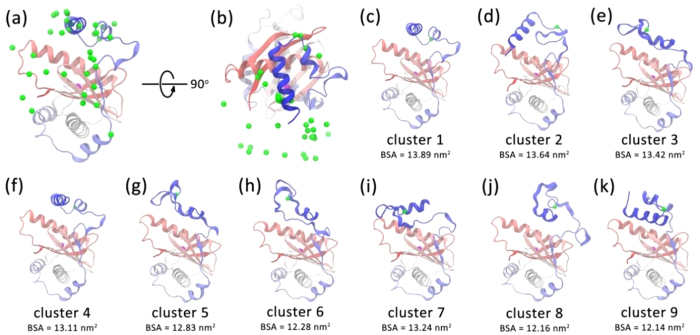
Figure 4. Representative structures with shorter Cys66-Glu175 Cα distances from the MD simulation.
Front view (a) and top view (b) of the cluster centre structures of the snapshots with the Cys66-Glu175 distance ranging from 1.7 to 2.4 nm in the metadynamics simulations using a cutoff of 0.6 nm. The protein is represented by the cartoon mode and is coloured from red to blue. The Cα atoms of Glu175 in the cluster centre structures are represented as green balls and the Cα atom of Cys66 is represented as magenta ball. (c–k) the centre structures with the BSA between longin domain and SNARE core of more than 12 nm2.

