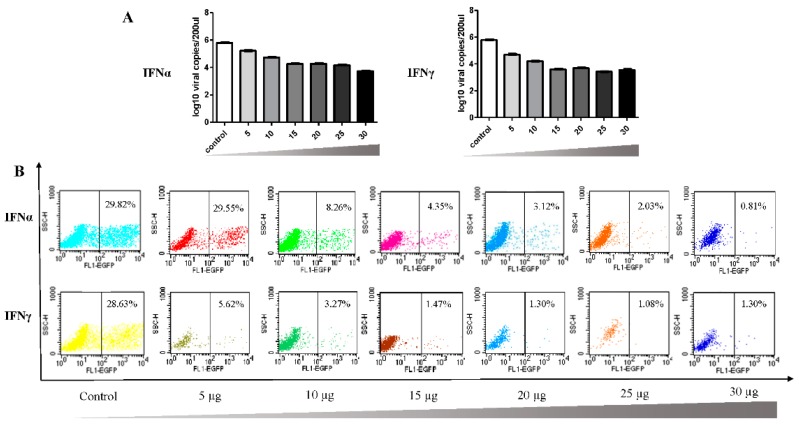
Figure 5.
Dose-dependent inhibition of DPV replication by IFNα and IFNγ as examined by viral copy number detection (A) and flow cytometry analysis (B). Effects of different concentrations of IFNα and IFNγ on DPV DNA copy numbers. DPV UL30 DNA copies in DEF cells of control groups and experimental groups were detected by RT-qPCR at 36 hpi after protein pretreatment as above. The number of UL30 DNA copies was assessed in triplicate wells. Flow cytometry analysis of DPV-EGFP positive cells with different concentrations of IFN were also analyzed by flow cytometry. The percentage of EGFP-positive cells automatically calculated by the CellQuest software. Flow cytometry was used to analyze cells with GFP fluorescence. Plots of the data indicate the percentage of cells expressing GFP (right quadrant) above the background level of fluorescence associated with the uninfected control cells.

