Figure 3.

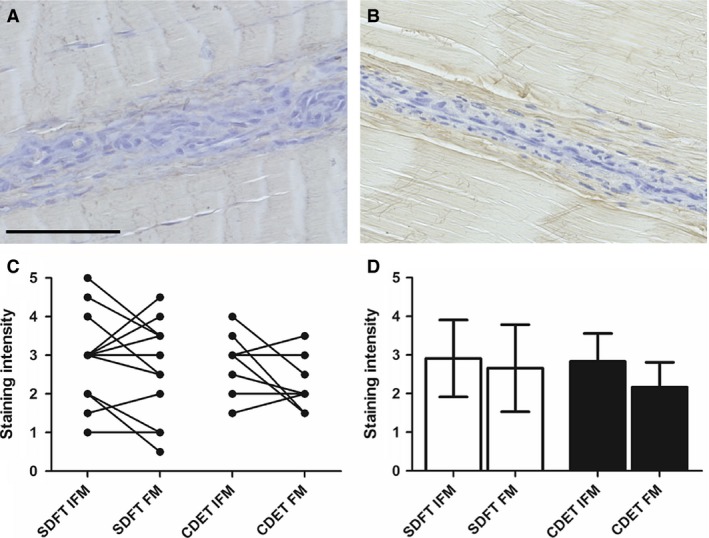
Representative images showing immunohistochemical staining of decorin in the SDFT (A) and CDET (B). Scale bar: 100 μm. There were no significant differences in decorin staining intensity between tendon types or regions (C,D). Individual data points are shown, with lines representing IFM and FM regions in the same image (C). In (D), data are displayed as mean ± SD.
