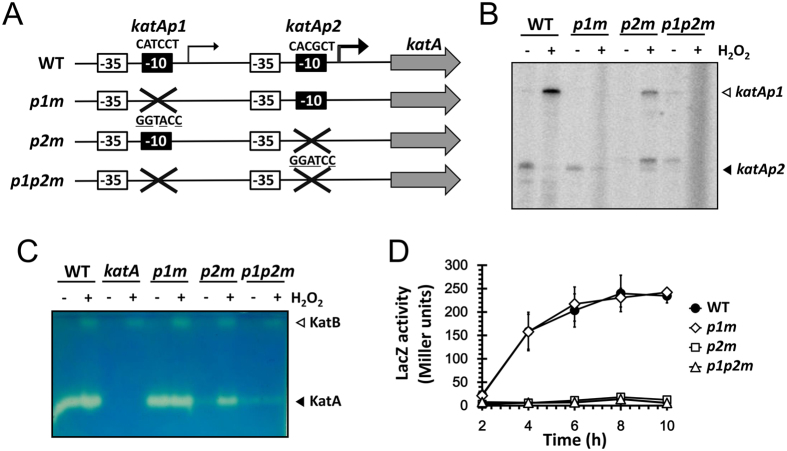
Figure 3. Creation of the katA promoter mutants.
(A) Schematic representation. The katA gene and its potential promoter elements (−35 and −10 boxes) are designated. The sequences of each −10 box are indicated above the boxes. The katA promoter mutations were constructed by substituting the −10 box with the KpnI site (GGTACC) for the katAp1 mutant (p1m) or the BamHI site (GGATCC) for the katAp2 mutant (p2m) as indicated with the mutated nucleotides underlined. A double mutant for both promoters (p1p2m) was generated as well. (B) Transcription upon H2O2 induction. Total RNA (50 μg) isolated from the wild type (WT) and the katA promoter mutant (p1m, p2m, and p1p2m) cells with (+) or without (−) 1 mM H2O2 treatment for 10 min at OD600 of 0.5 in LB were subjected to low-resolution S1 nuclease assay. The two transcriptional start sites of the katA gene are indicated by open (katAp1) and closed (katAp2) arrows. (C) Catalase activity staining upon H2O2 induction. Catalase activities in cell extracts of the wild type (WT) and the katA null and promoter mutant (katA, p1m, p2m, and p1p2m) cells with (+) or without (−) 1 mM H2O2 treatment for 10 min as in (B) were visualized using 50 μg of proteins in each cell extract. The two catalase bands are indicated by open (KatB) and closed (KatA) arrows. (D) Promoter activity during aerobic planktonic growth. The wild type cells harboring one of the promoter transcription fusions (•, WT; ◇, p1m; □, p2m; ∆, p1p2m) were grown in LB amended with 15 mM KNO3. Culture aliquots were taken at every 2 h from 2 to 10 h post-inoculation and then subjected to β-galactosidase (LacZ) assay. The data represent the average of the means of three independent experiments (two cultures per experiment), with the error bars representing the standard deviations.

