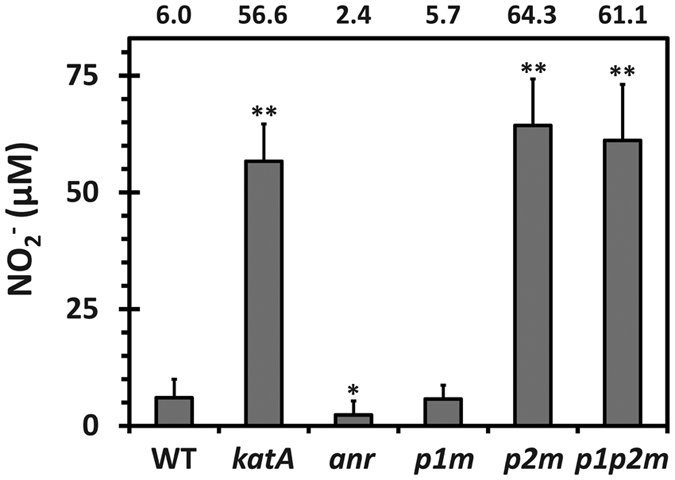
Figure 6. Accumulation of NO2− in the katA promoter mutants.

Steady-state level of extracellular NO2− was measured in the wild type (WT) and the katA null and promoter mutant (katA, p1m, p2m, and p1p2m) cells as well as anr mutant cells that had been grown to OD600 of 0.7. The amount (μM) of NO2− is calculated using the standard curve (r2 = 0.999) and the average values measured from the three independent experiments, with the error bars representing the one positive value of the standard deviations. Statistical significance based on the Student’s t-test is indicated (*p < 0.01; **p < 0.005).
