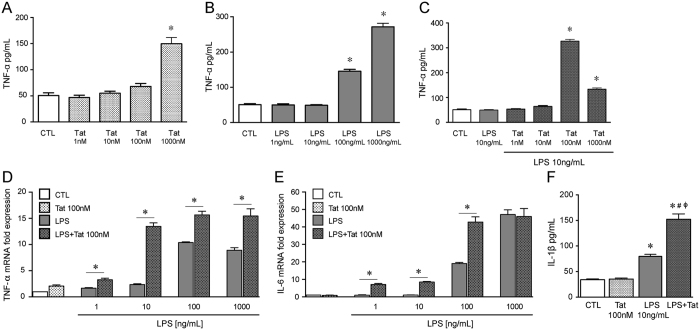
Figure 3. Tat and LPS interaction in the CRL-2690 enteric glia cell line.
(A) Release of TNF-α of CRL-2690 enteric glia after treatment with 1–1000 nM Tat for 16 h. (B) Release of TNF-α of CRL-2690 enteric glia after treatment with 1–1000 ng/mL LPS for 16 h. (C) Release of TNF-α of CRL-2690 enteric glia after treatment with 10 ng/mL LPS or LPS + 1–1000 nM Tat for 16 h. (D) Normalized fold TNF-α mRNA expression of CRL-2690 enteric glia after treatment with 100 nM Tat in combination with 1, 10, 100 or 1000 ng/mL LPS for 16 h. (E) Normalized fold IL-6 mRNA expression of CRL-2690 enteric glia after treatment with 100 nM Tat in combination with 1, 10, 100 or 1000 ng/mL of LPS for 16 h. (F) Release of IL-1β of CRL-2690 enteric glia after treatment with 100 nM Tat or 10 ng/mL LPS or both for 16 h. For each study n = 3, P < 0.05. One-way ANOVA plus Bonferroni’s post hoc test. *Vs CTL, #Vs Tat, ϕVs LPS.

