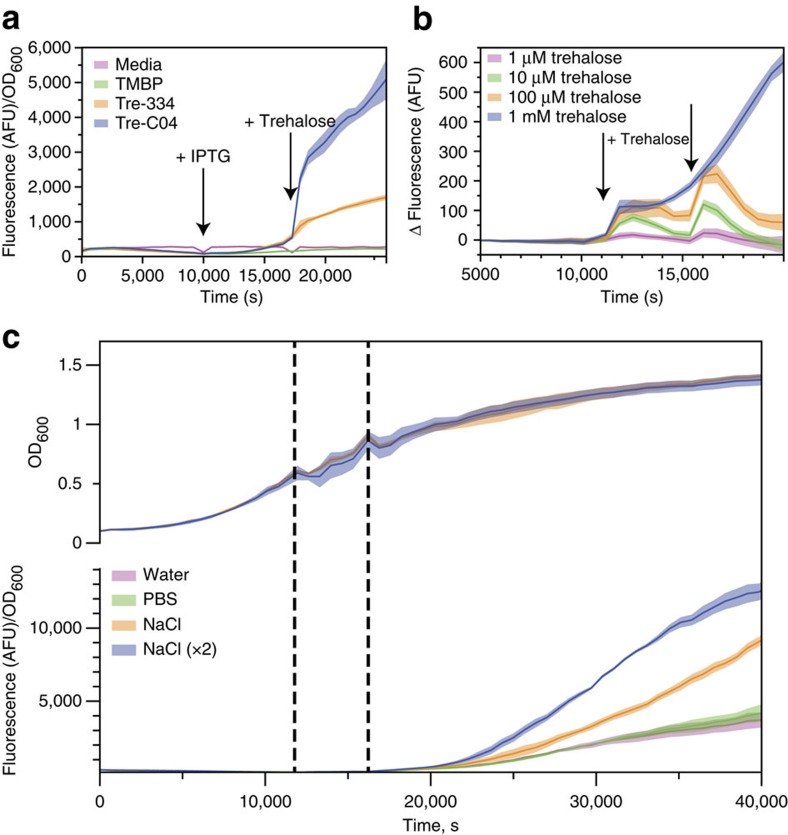
Figure 5. The optimized trehalose biosensor reports trehalose concentrations in vivo.
(a) The fluorescence response of the parental and optimized trehalose biosensors, Tre-334 and Tre-C04, respectively, to 1 mM trehalose addition (indicated by arrow). Negative controls of media and TMBP are also shown. Data are mean±s.d. for three replicates. (b) Response of optimized trehalose biosensor, Tre-C04, to 1, 10, 100, or 1000 μM trehalose during exponential growth. Arrows indicate the timing of trehalose addition. Fluorescence was background corrected against a culture treated with water instead of trehalose. Data are mean±s.d. for 12 replicates. (c) OD600 (upper panel) and fluorescence response (lower panel) of Tre-C04 to the addition of water, PBS or 300 mM NaCl (once or twice). Dashed lines indicate additions. Data are mean±s.d. for four biological replicates.

