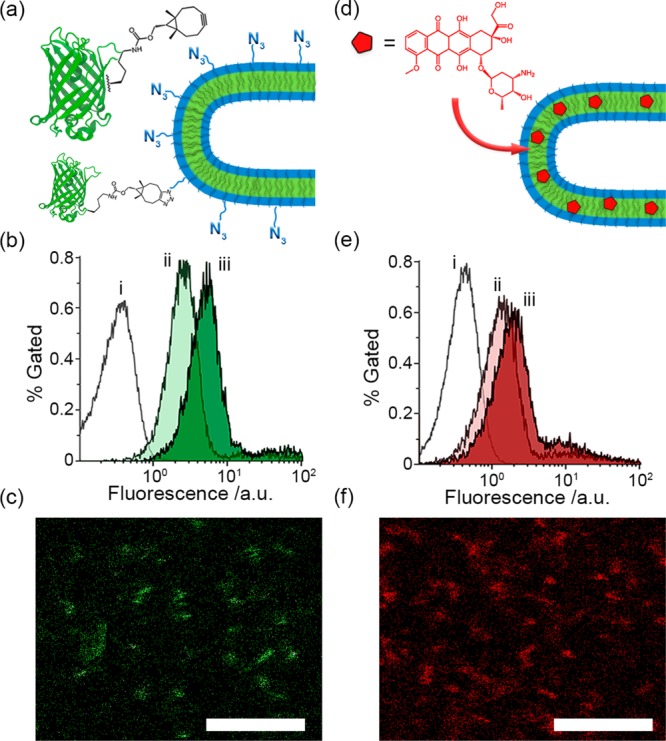
Figure 3.

(a) Schematic outlining the covalent modification of azide-modified nanotubes using eGFPBCN, (b) flow cytometry data for eGFP modification of 5% azido nanotubes using an equimolar (ii) or a 3-fold excess (iii) of eGFPBCN compared to unmodified tubes (i) and (c) confocal visualization of green-fluorescent nanotubes. (d) Schematic outlining the loading of nanotubes with fluorescent DOX, (e) flow cytometry data of nanotubes loaded with 2 (ii) and 5 (iii) wt % DOX compared to unloaded tubes (i) and (f) confocal visualization of DOX-loaded nanotubes (5 wt % preparation). All scale bars = 5 μm.
