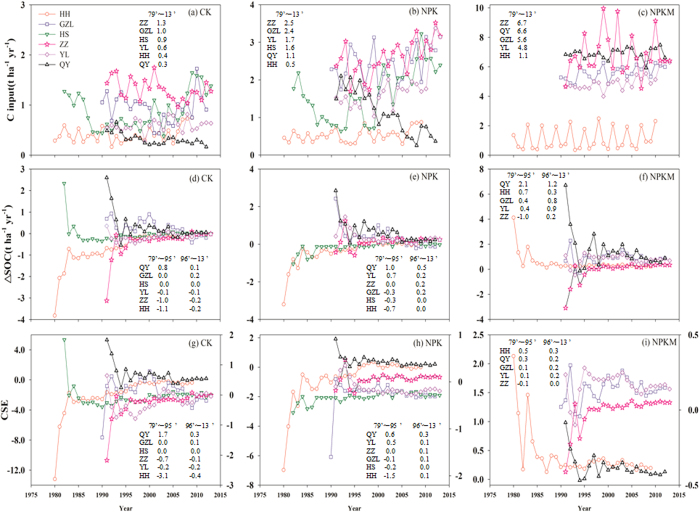
Figure 1.
The carbon input (t ha−1 yr−1), change in SOC storage (ΔSOC, t ha−1 yr−1) and carbon sequestration efficiency (CSE) from the initial year to 2012 under CK, NPK and NPKM treatments at six fertilization experimental sites in China (panels a~i). The inset in each panel denotes the average carbon input, ΔSOC or CSE during 1979 to 1995 and during 1996 to 2012 at each specific site displayed in a descending order from top to bottom.

