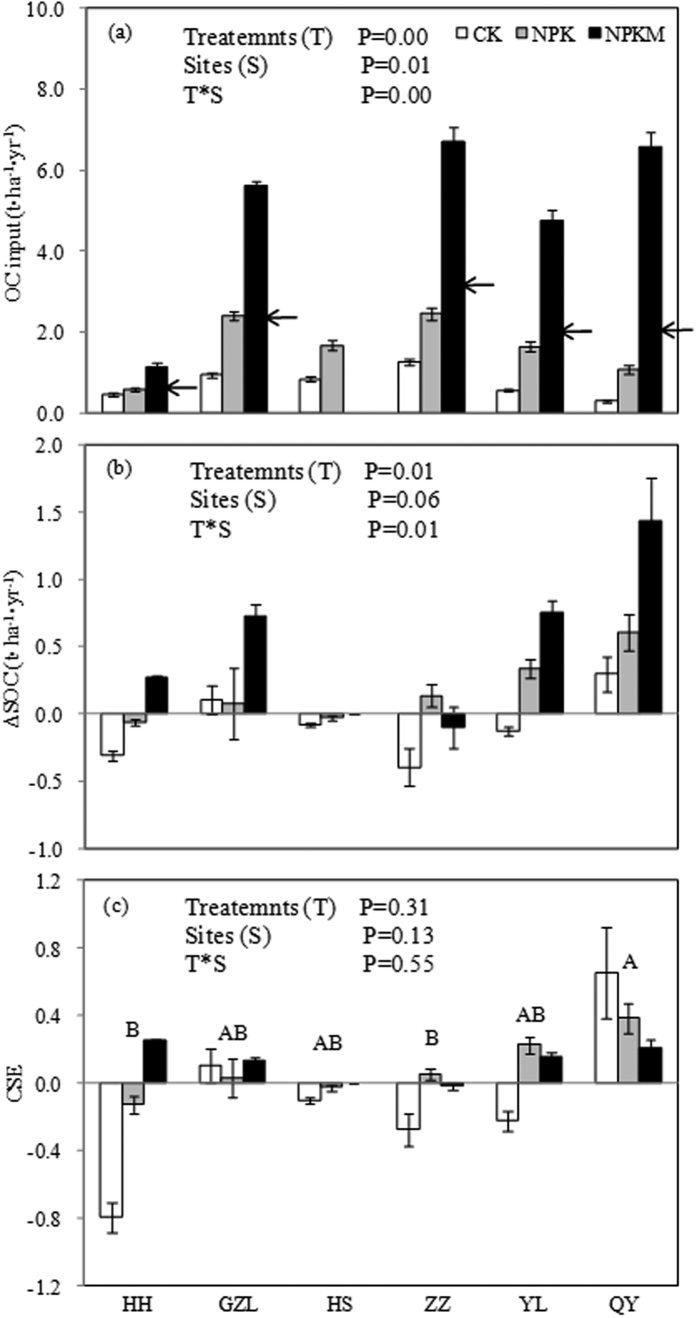
Figure 2. The main and interactive effects of fertilization treatment (T) and site (S) on C input, change in SOC storage (ΔSOC) and CSE at the six fertilization experimental sites in China based on repeated measure two-way ANOVA.
The different capitalized letters denote significant difference between sites at P < 0.1. In panel (a), bar height below each arrow denotes the yearly mean OC input via crop residual at each site and the rest from manure input.

