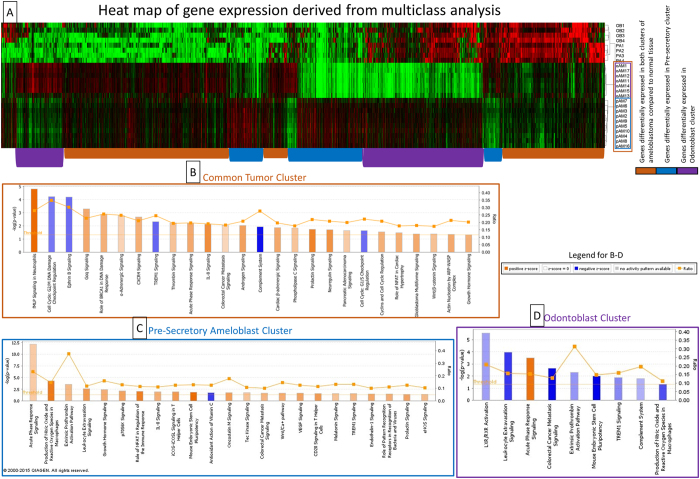
Figure 3. Multiclass and pathway analysis of the different tumor clusters.
(A) – Heat map of the genes with a FDR < 1% that are differentially expressed in the 4 clusters (OB – odontoblast, PA – pre-Secretory Ameloblast, oAM – odontoblast-like ameloblastoma, pAM – pre-secretory Ameloblast-like ameloblastoma) from a SAM multiclass analysis. The cluster tree on the right shows the 2 distinct clusters of ameloblastoma. Groups of genes with similar expression (identified by colored bars at the bottom of the heat map) were used for pathway analysis for the different clusters of ameloblastoma which were shown in (B–D). (B) – Canonical pathways that are differentially expressed for the Common tumor cluster in IPA. (C) – Canonical pathways that are differentially expressed for the Pre-secretory ameloblast cluster in IPA. (D) – Canonical pathways that are differentially expressed for the odontoblast cluster in IPA.

