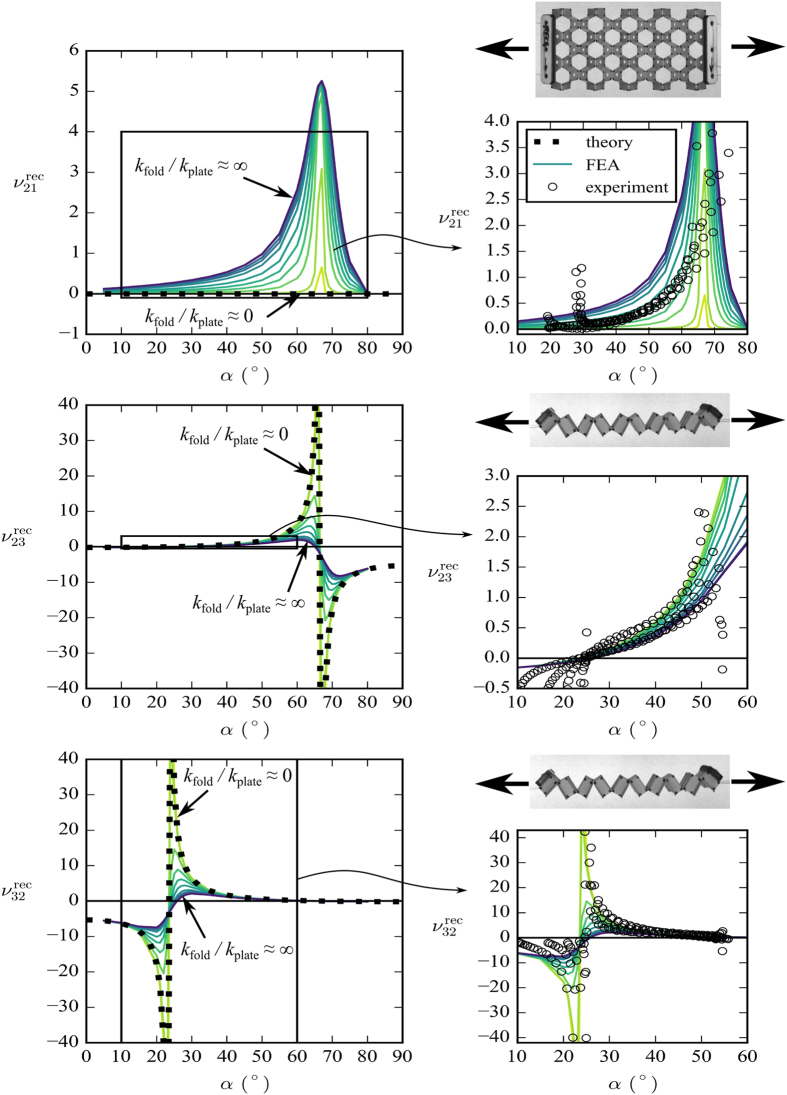
Figure 6. Experimental results compared to model predictions.
The dotted line shows the rotating rectangles theory. The solid lines show the FEA results. The circles show the experimental results. We expect the experimental results to follow one of the FEA lines between kfold/kplate = 0 and kfold/kplate = ∞. The fixed honeycomb dimensions are h = l = 5 mm, b = 10 mm, t = 0.25 mm, and θ = 30°.

