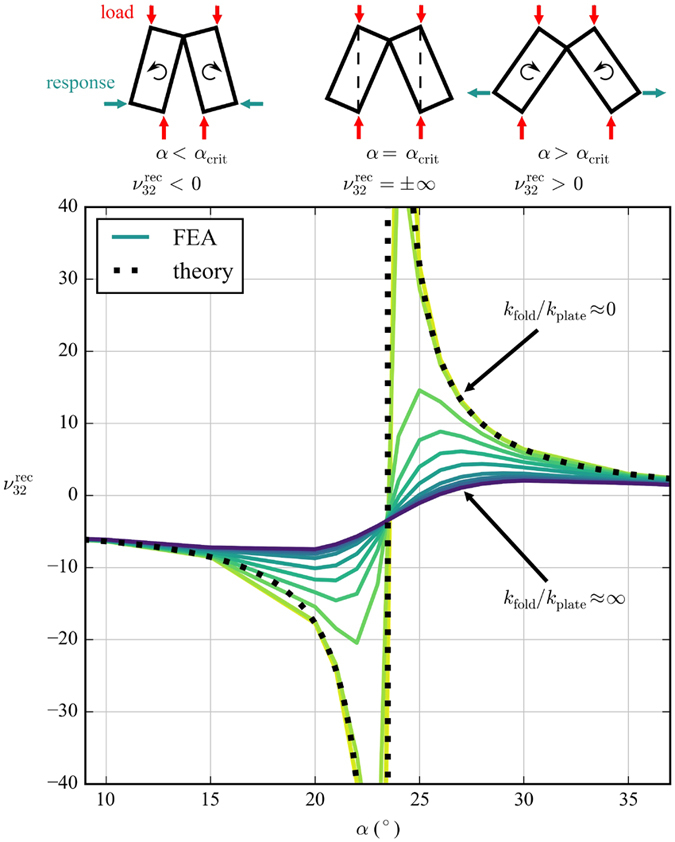
Figure 8. Poisson’s “switch” behaviour in the open rec configuration around the critical value of α.

The rectangles at the top represent strips of the honeycomb (half a unit cell) viewed in the 2–3 plane, and their direction of rotation in response to a compression along the 3-direction.
