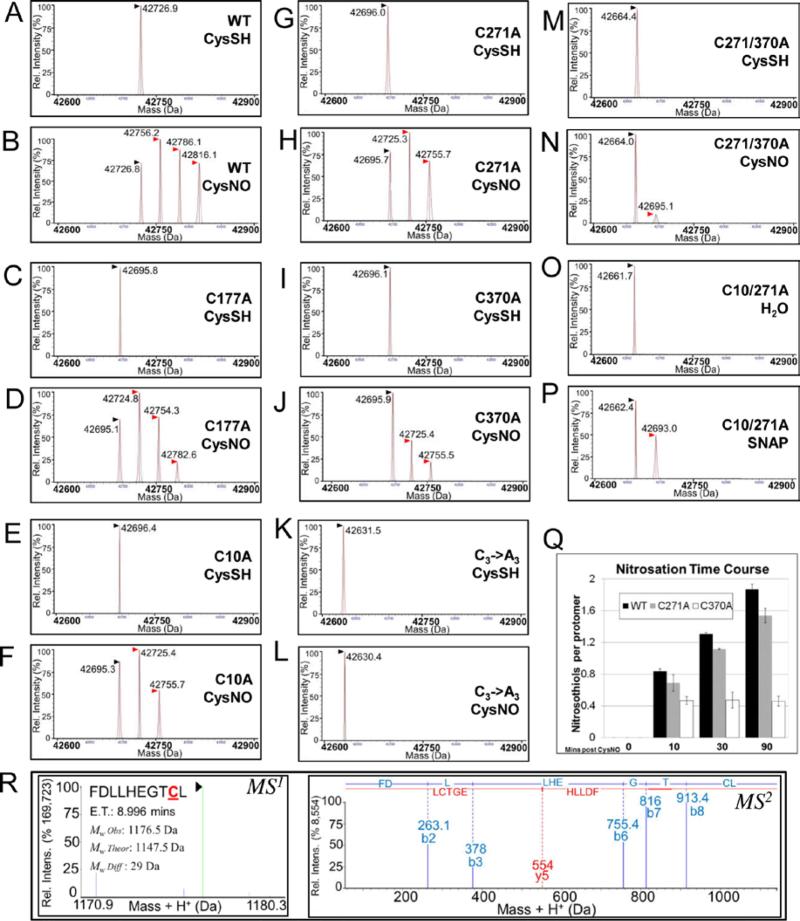
Figure 2. AtGSNOR nitrosation is decreased by replacement of conserved cysteines with.
A-P: Deconvolved mass spectra of wild-type and AtGSNOR cysteine mutants treated with the NO donors CysNO (B,D,F,H,J,L,N) or SNAP (P) or with CysSH (A,C,E,G,I,K,M) or water (O) as controls. Black (▶) and red ( ) arrowheads designate unmodified GSNOR and nitrosated GSNOR adducts (+29 Da), respectively. CysSH: Cysteine. CysNO: S-nitrosocysteine. Q: Time course of CysNO-induced nitrosation of wild-type and mutant AtGSNORs. Nitrosothiols per protomer were calculated from relative distributions of deconvolved mass adducts in two biological replicates, and error bars indicate one standard deviation. R: Representative MS1 (left) and MS2 (right) spectra of a nitrosated peptide from CysNO-treated AtGSNOR. ET: Elution time.

