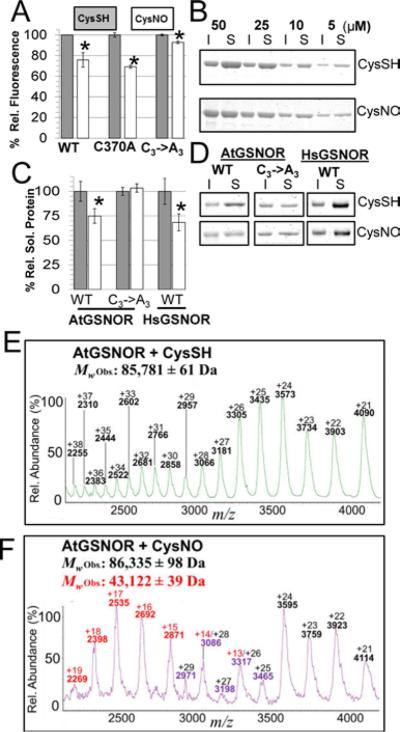
Figure 6. Intrinsic fluorescence, thermal stability, and polydispersity are affected by GSNOR nitrosation.
A. Normalized maximum fluorescence emission intensities (Ex: 280nm, Em: 335-340nm) of wild-type and mutant AtGSNORs treated with CysSH (gray) or CysNO (white). Error bars represent 2 times standard error from three or more experiments. B. AtGSNOR treated with CysSH or CysNO was incubated at 45 °C for 30 mins at the indicated concentrations, after which insoluble (I) and soluble (S) material were separated by SDS-PAGE and visualized by Coomassie G-250 staining. C. Experiments were carried out as in B with the indicated proteins at 20 μM, after which protein band intensities were quantified with a LiCoR Odyssey flatbad scanner. D. Representative Coomassie-stained gels for quantification in C. E-F: Distribution of native AtGSNOR charge states under control (E) and nitrosating (F) conditions.

