Figure 1.

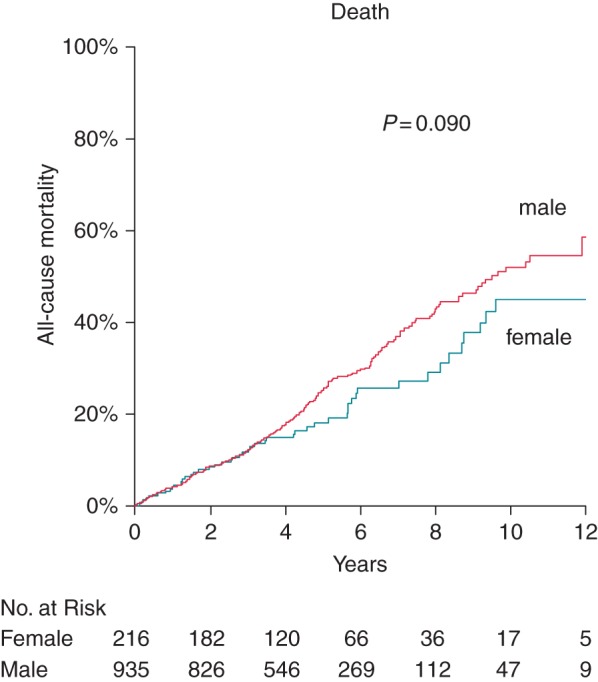
Cumulative Kaplan–Meier event probability of death according to sex: male (red line) and female (blue line) patients. Unadjusted P-value is shown in the figure.

Cumulative Kaplan–Meier event probability of death according to sex: male (red line) and female (blue line) patients. Unadjusted P-value is shown in the figure.