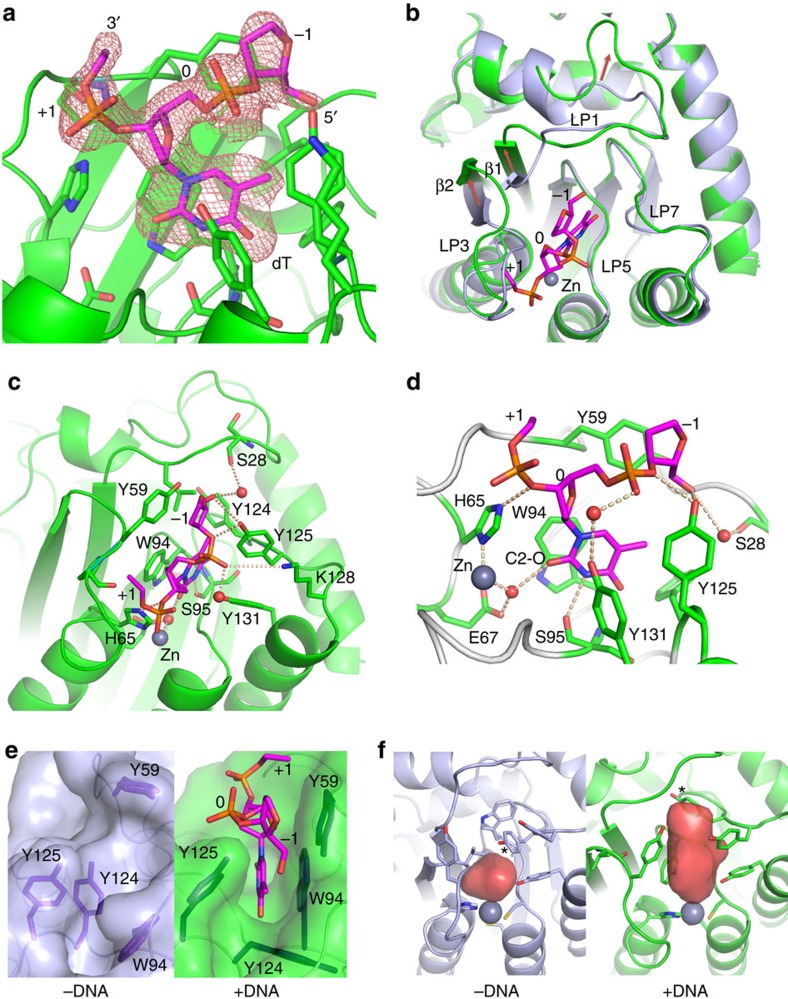
Figure 3. The co-crystal structure of rA3G-CD1 in complex with a poly-dT ssDNA.
(a) The electron density map (2FoFc, contoured at 1 σ level) for the three nucleotides of the bound poly-dT, which corresponds to one complete dT nucleotide at position 0, the phosphor-backbone/sugar residue at the −1 (5′-end), and the phosphor-backbone at the +1 (3′-end) positions. The amino acid residues important for binding poly-dT are shown in sticks. (b) Superimposition of the apo (light blue) and ssDNA co-crystal (green) structures of rA3G-CD1. The nucleotides of the bound ssDNA at the Zn-centre are shown in sticks. Red arrows indicate the major conformational shifts of loop-1/β1 and β2/loop-3 upon DNA binding. (c) Detailed bonding interactions between poly-dT and amino acid residues (stick) in the Zn-centre pocket. Zn atom is presented as grey sphere, water molecules as red spheres, hydrogen bonds and electrostatic interactions as dashed lines. (d) A zoom-in view of poly-dT bound to the Zn-centre pocket from c. The carbonyl group at C2 (C2–O) of the inserted dT at position 0 is labelled. (e) The surface representation of the DNA binding pocket in the apo protein (left) and upon ssDNA binding (right). Y59 (loop-3), W94 (loop-5) and Y124 (loop-7) shown in sticks change conformations markedly to accommodate the inserted dT residue. (f) Comparison of the Zn-centre pocket volume of rA3G-CD1 before and after binding to poly-dT ssDNA. Red surfaces represent the DNA binding pockets. Star indicates residue Y124.

