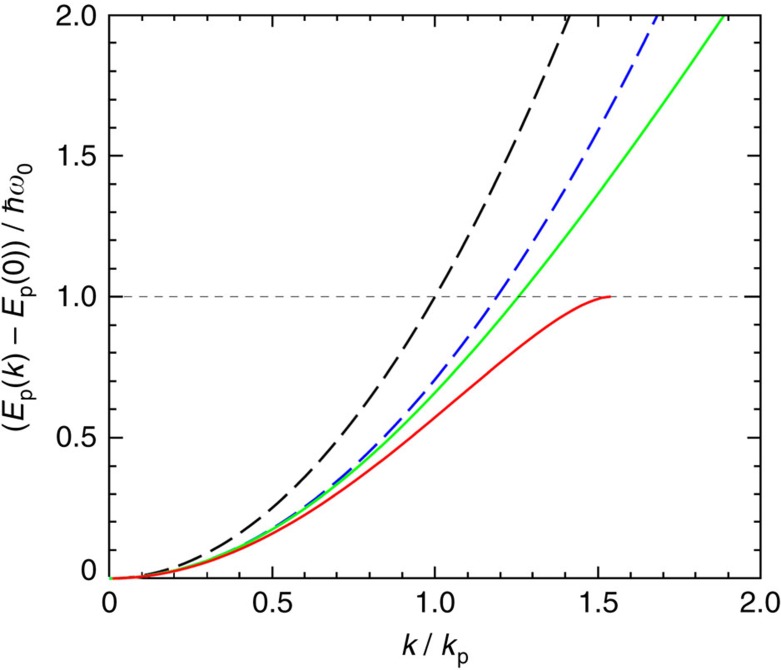
Figure 6. Polaron energy-momentum relation.
This plot compares the shape of the energy-momentum curves for different models calculated with the electron–phonon coupling constant αe−ph≃2.5. The energy is measured in units of the vibrational energy ħω0 and the wave number in units of kp=(2mω0/ħ)1/2. The dashed lines show the parabolic dispersion, for the bare band carrier (black) and for the polaronic carrier with renormalized mass mp (blue). The solid lines display the non-parabolic dispersion obtained with variational calculations, according to Lee–Low–Pines theory11,30 (green curve) and according to Larsen theory13,31 (red curve). The latter is shown in the limited range of its applicability, but it is this type of the dispersion that was actually confirmed in the state-of-the-art diagrammatic Monte-Carlo calculations32.

